General description
SkyCiv has included a new powerful feature consisting of the plate response spectrum analysis in the platform. In this article, we will cover an example of a small building, as the following image shows. The primary purpose is to explain some essential details when executing a similar analysis by yourself.
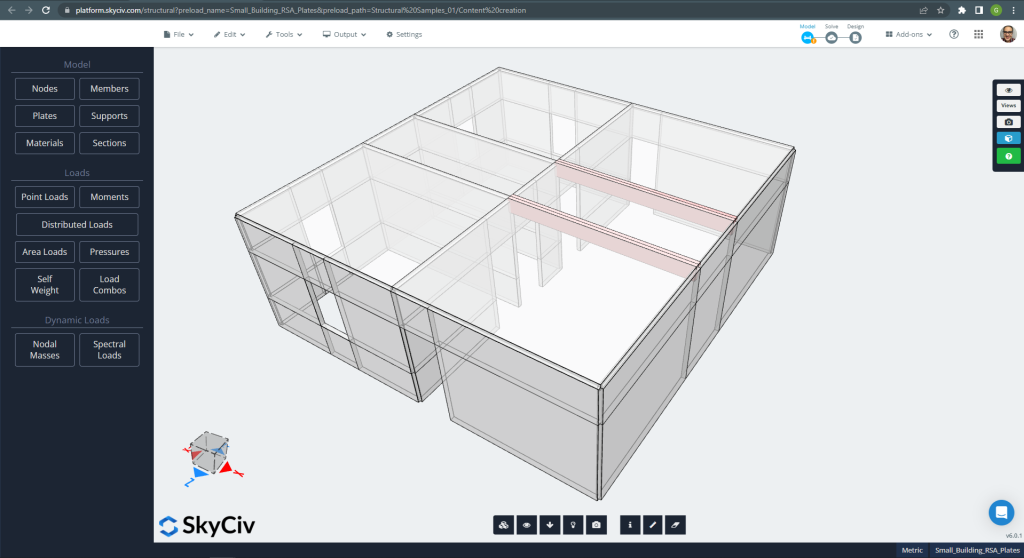
Figure 1. Small Building Example
You can see that the small reinforced concrete structure has walls and slabs built using the SkyCiv plate element. When designing the building for dynamic loads such as earthquakes, most construction codes establish some methods such as the ‘Response Spectrum Procedure or Analysis (RSA).’
The RSA consists of taking the seismic design level acceleration through a smooth curve given by the code. You can read these SkyCiv articles: Response Spectrum Analysis: A Building Example and Response Spectrum Analysis: Modal Combination Methods for more information and examples Response Spectrum Analysis: Building Examples and Response Spectrum Analysis: Modal Combination Methods.
If you are new at SkyCiv, Sign up and test the software yourself!
Finite Element Model: Plates Dynamic Analysis
Once the geometry and materials for the example have been defined, the next crucial step is to run a linear analysis of a meshed structure. Please take a look at the model in Figure 2.
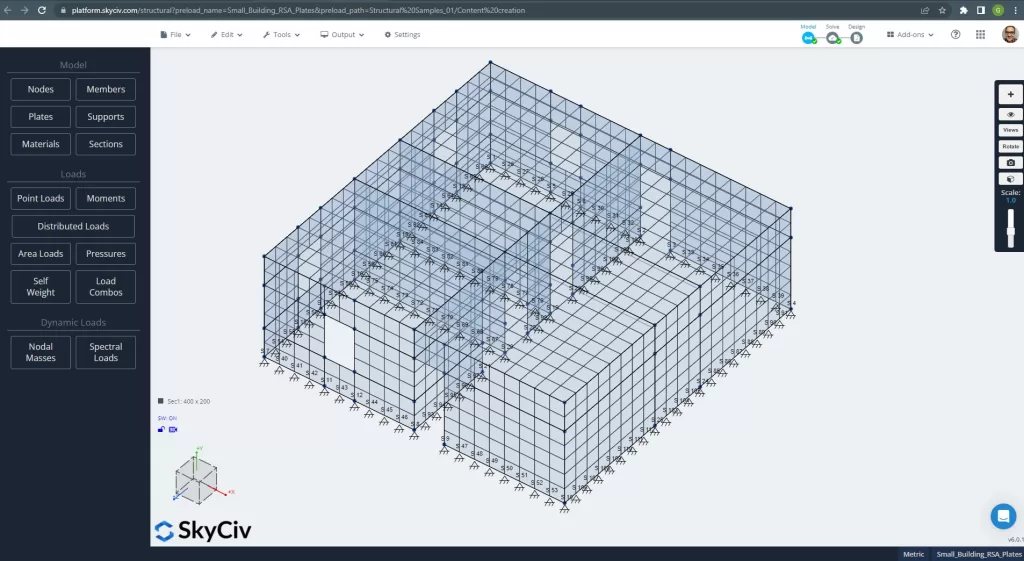
Figure 2. Meshed Small Building
The motion equation to solve when running a response spectrum analysis has the shape of:
\({M_e}{\ddot{X_e}}+{C_e}{\dot{X_e}}+{K_e}{X_e}={-\ddot{X_0}{(t)}{M_e}{J}}\)
Where:
- \({M_e}\) is the consistent matrix for masses.
- \({C_e}\) is the damping matrix (Often, this value could be calculated as the linear combination of stiffness and masses matrices \({C_e}={\alpha}{K_e}+{\beta}{M}\) ).
- \({K_e}\) is the stiffness matrix.
- \({X_e}\) is the displacement vector relative to the structure’s base.
- \({X_0}{(t)}\) is the soil displacement vector (It has all degrees of freedom: 3 displacements and three rotations).
- \({J}\) is a vector with unitary components.
Due SkyCiv using the Finite Element Method for Plates, the matrix \({M_e}\) could be obtained through the following expression for Kinetic Energy:
\({E_c}={\frac{1}{2}}{\int_{vol} {\rho}{\dot{x}^2}{dw}Vol}\) .
We now write the \(x\) displacement as a function of its nodes and use some interpolation expressions (\(N_{x}^{T}\)).
\({x}=N_{x}^{T} {x}\). If we plug this value into the energy equation, we get:
\({E_c}={\frac{1}{2}}{\dot{x}^{T}}\{{\int_{vol}{\rho}{N}{N^T}{d}{Vol}}\} \dot{x} \)
So, we can say that:
\( M = {\int_{vol}{\rho}{N}{N^T}{d}{Vol}}\)
Defining the above matrix lets us run a modal analysis, which is required for the dynamic analysis. Figure 3 helps us with some recommended inputs.
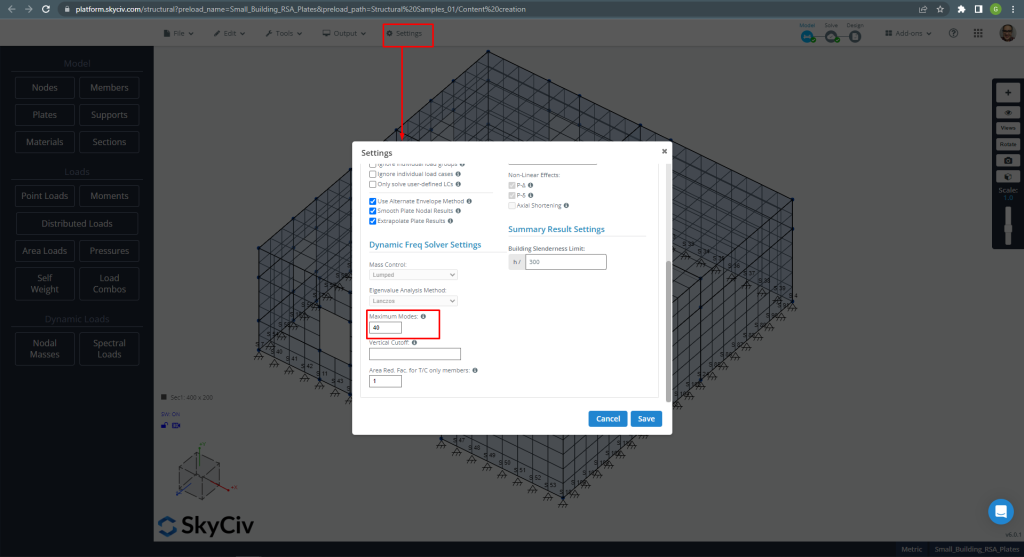
Figure 3. Maximum modes considered increased up to 40
Increasing the total number of modes is recommended until strictly fulfilling codes. This will affect the total mass participation factors, which have to reach a value of 90%.
Spectral Loads
The next step is to define the spectral loads. We can include a custom function or take the cases previously built by the SkyCiv platform. This example uses for each building plan main direction an ASCE plot. Check the inputs in Figure 4 and Figure 5.
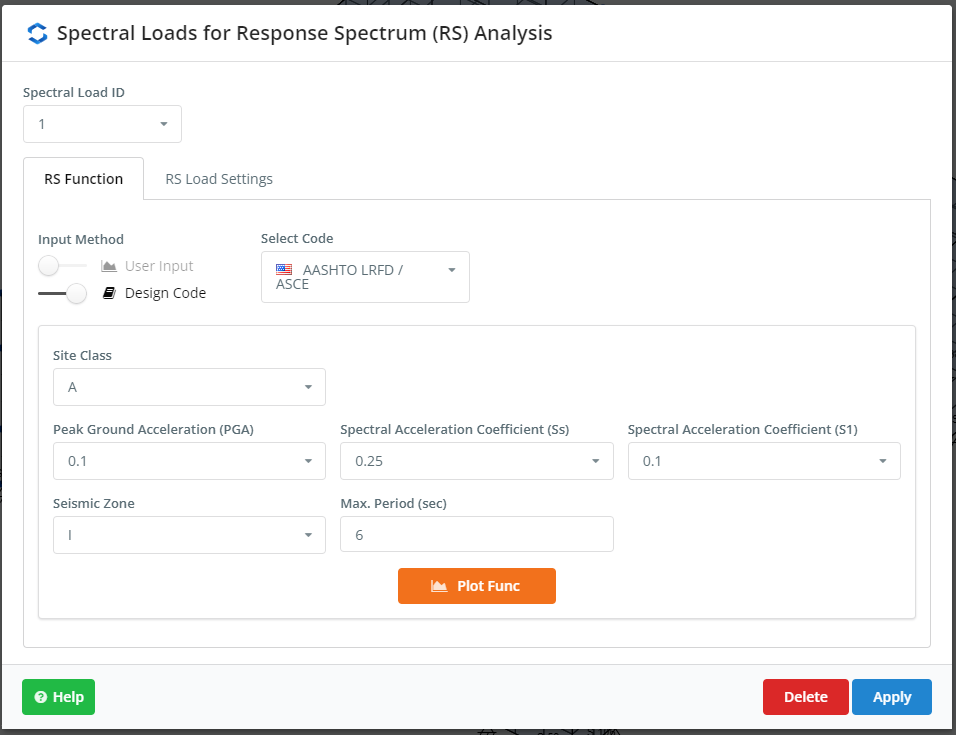
Figure 4. Settings for RSA, part one
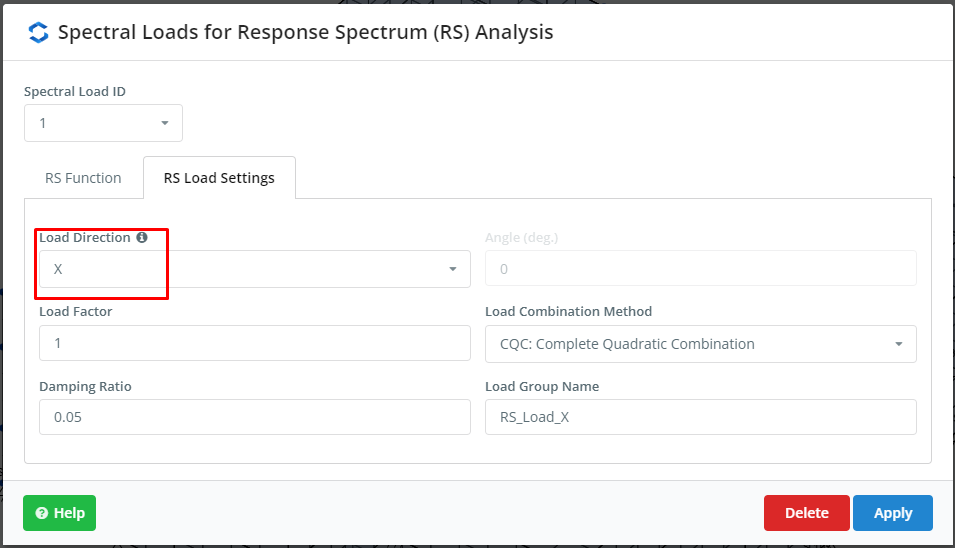
Figure 5. Settings for RSA, part two
If you are new at SkyCiv, Sign up and test the software yourself!
Results analysis and conclusions
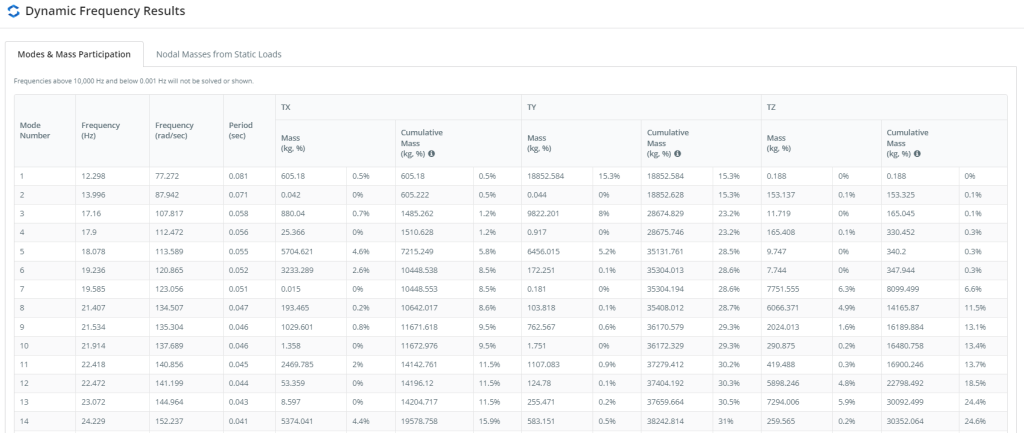
Figure 6. Modes and Mass Participation Summary, part one
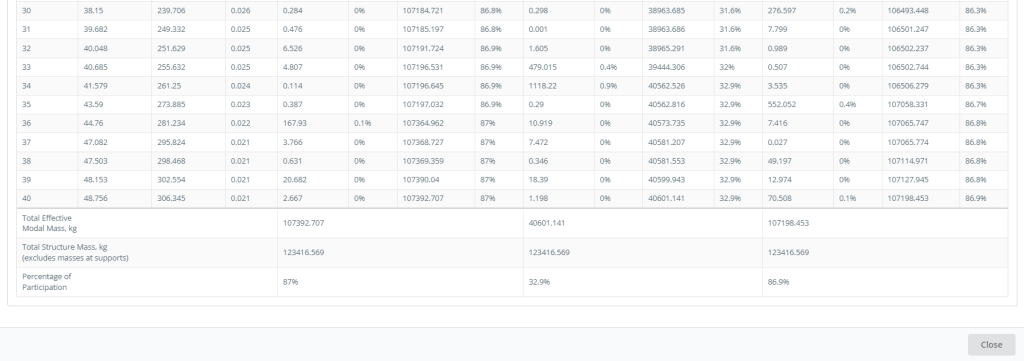
Figure 7. Modes and Mass Participation Summary, part one
Figures 6 and 7 give the modes and mass participation values. These tables define the principal modes in each plan direction corresponding to those with the highest mass participation values.
Mode 24, T = 0.029 seconds, mass participation = 44.80 % ‘x direction’:
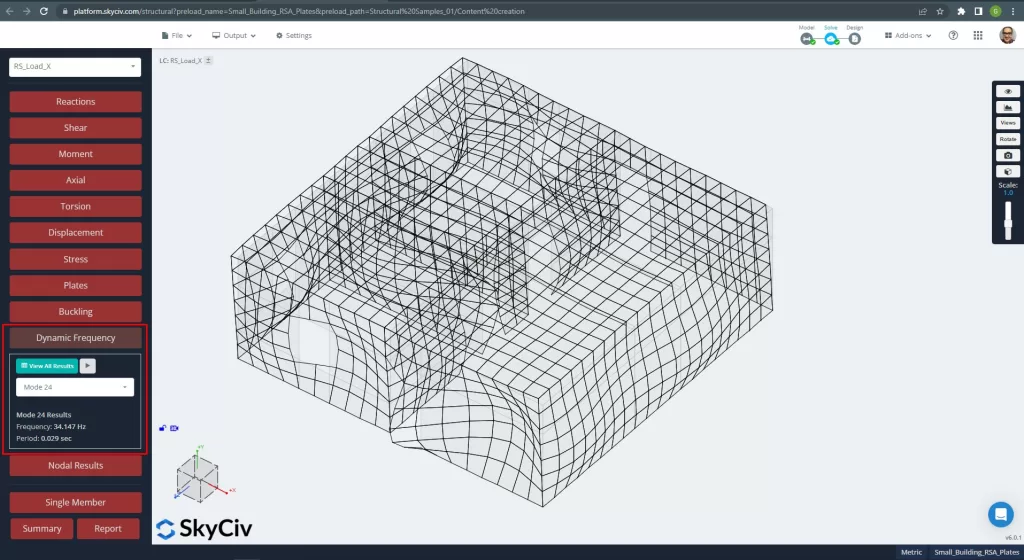
Figure 8. Main modal mode for X direction.
Mode 23, T = 0.030 seconds, mass participation = 41.80 % ‘z direction’:
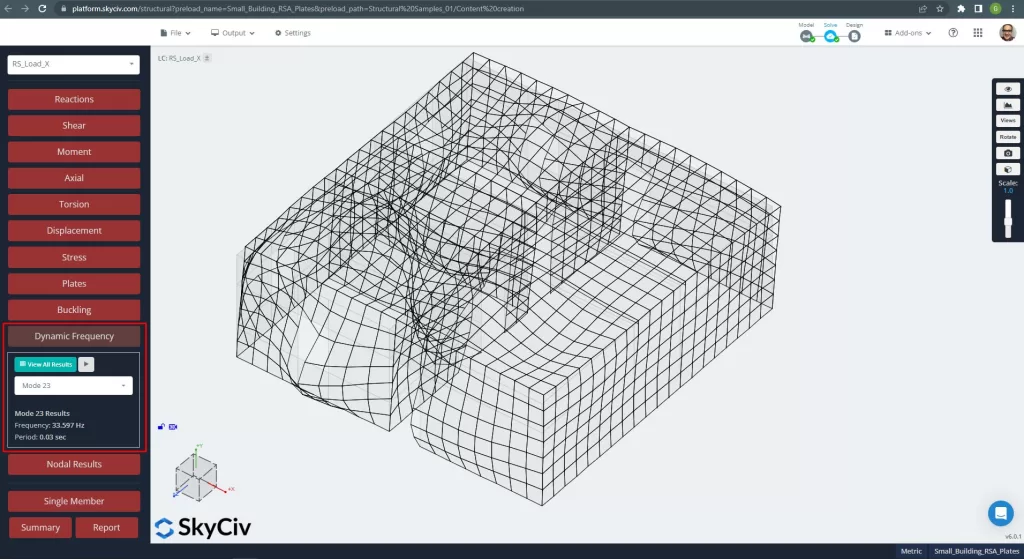
Figure 9. Main modal mode for Z direction.
SkyCiv also gives the displacements, forces, stresses, and so on when running the RSA. The following images help us to understand how the buildings behave.
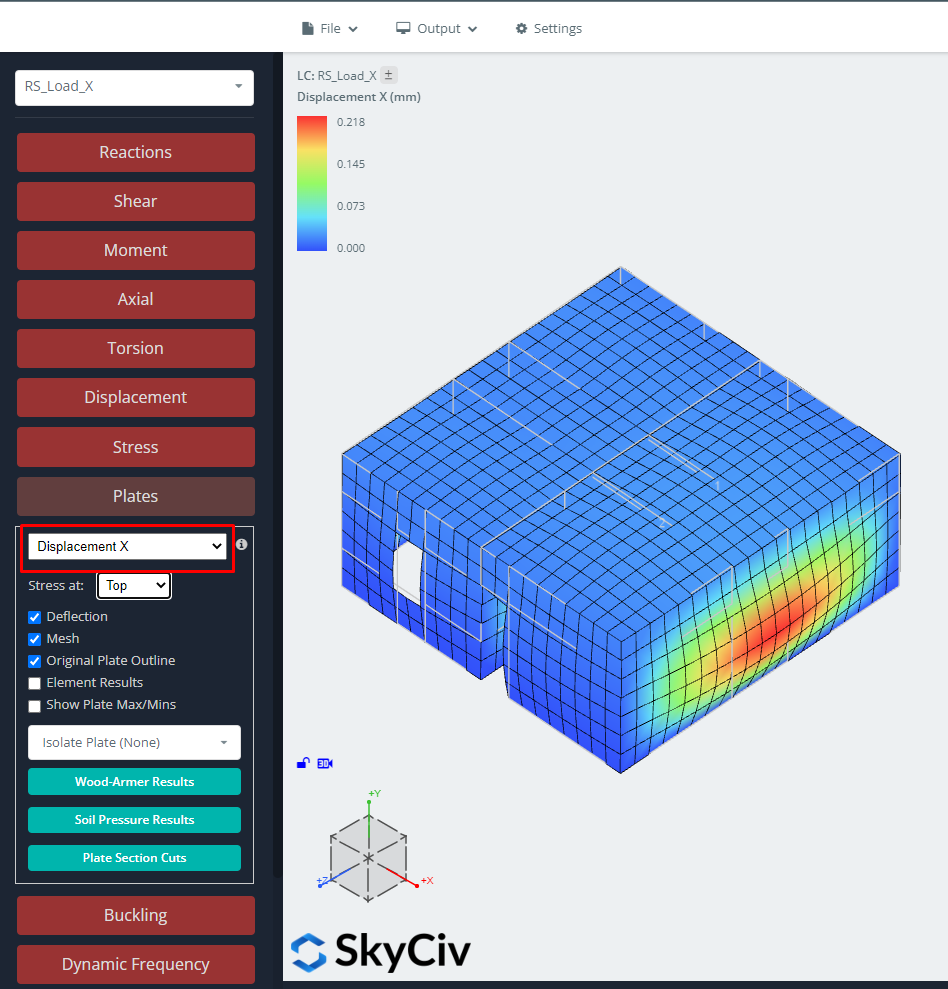
Figure 10. Displacements in X direction for RSA load case.
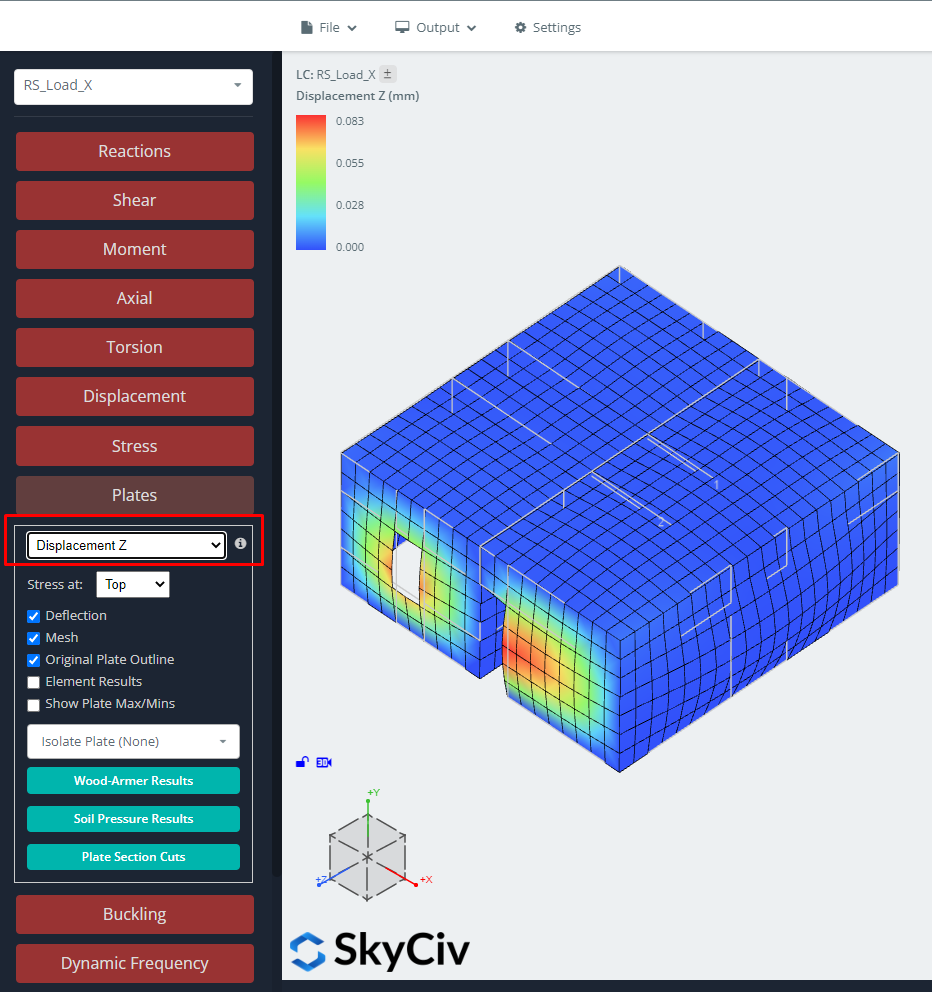
Figure 11. Displacement in the Z direction for RSA load case.
You can now design the plate elements with those results. We suggest you read the SkyCiv articles about Plate Design: Plate Design Module and applied code-based slabs examples in the following links: ACI, AS-3600 and Eurocode 2.
Also, with SkyCiv, we can get the base reactions for the foundation design.
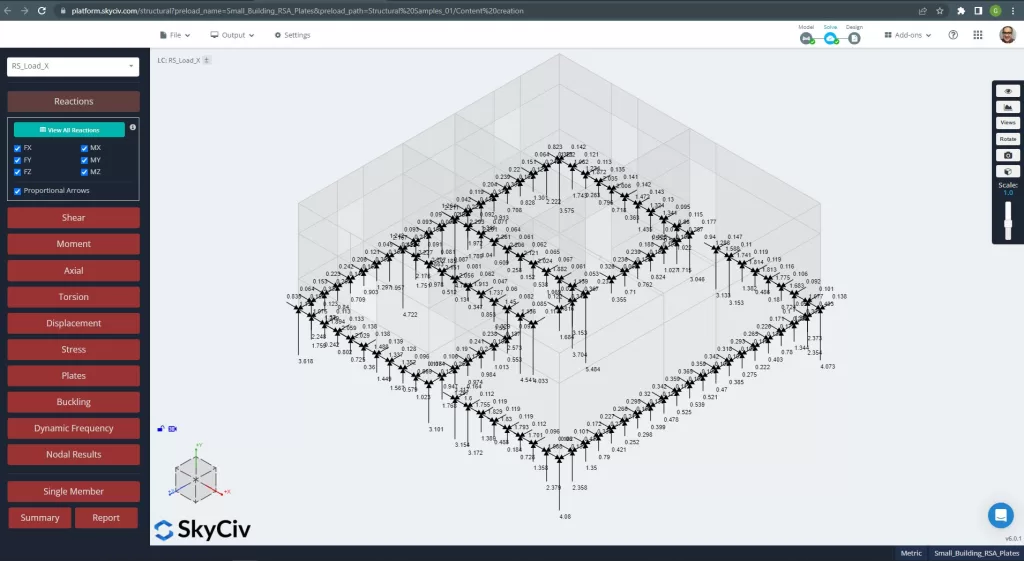
Figure 12. Base reactions for RSA load case.
Just be aware of the results signs! All of them came in positive or absolute values. This is because we get the maximum absolute values for each design component when using an RSA method.
If you are new at SkyCiv, Sign up and test the software yourself!