Calculate the natural frequencies of your structure in Structural 3D
Dynamic Frequency Analysis, or modal analysis, is needed to determine the natural frequencies (or resonant frequencies) of a structure in order to predict its maximum response. When a vibration load applied to the structure matches the natural frequency, it can be dangerous leading to the destruction of the system.
Input
Users can add nodal masses easily, by simply converting their existing static loads into nodal masses. SkyCiv Structural 3D will automatically calculate the nodal masses (based on your load groups) and apply them to the structure, so your model can be analysed for dynamic frequency effects. To start, click Nodal Masses from the left menu than ‘convert Loads to Masses.’
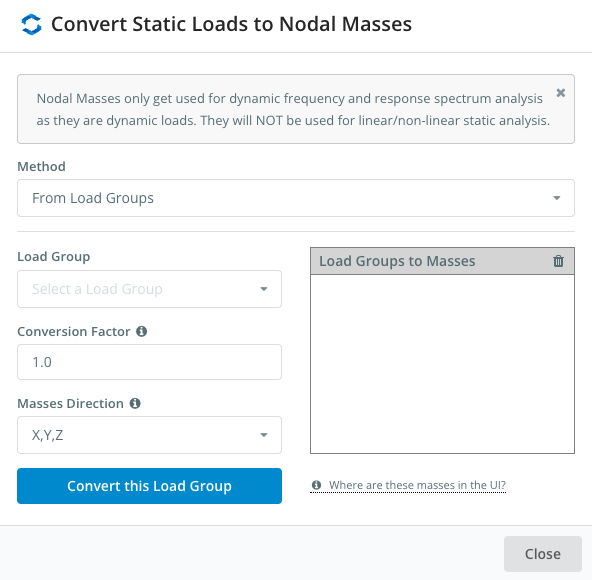
This allows users to add load groups and convert them to modal masses, giving the user full control of which loads are included, with controls for mass directions and factors.
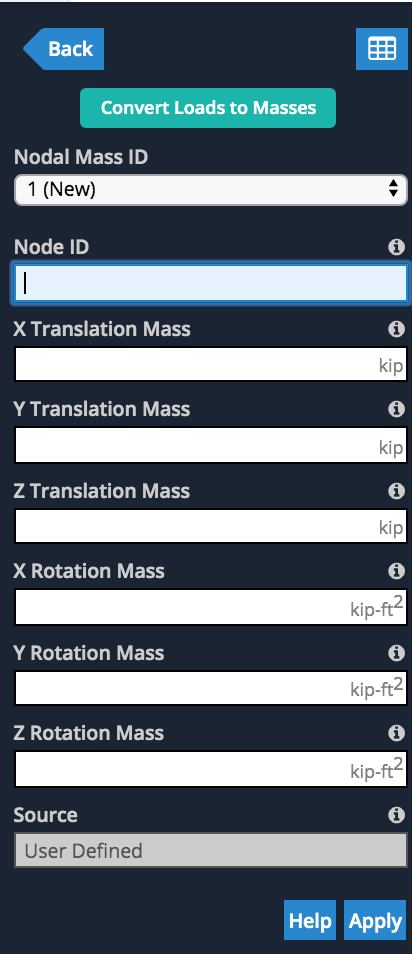
Users can also specify their own nodal masses at any node by entering in the X,Y,Z translational and rotational mass values:
Dynamic Frequency Analysis
The SkyCiv Dynamic Frequency analysis calculates the lowest eigen-frequencies of the structure, by solving the eigenvalue equation below. In a static analysis, we are assuming the system does not depend on time. In dynamic analysis, there is a time dependency.
During the dynamic frequency analysis we are solving the mode shapes and frequencies under vibration. Specifically we solve the vibrational frequency (cycles per second) and period (the time taken to complete one cycle) for each mode shape of the structure.
The following formula represents the calculations performed by the Structural 3D during a frequency analysis:
[M][U¨]+[K][U]=[0]
[M] = Structure mass matrix,
[K] = Structure stiffness matrix,
[U] = displacement,
[U¨] is the double derivative of displacement with respect to time (i.e. acceleration).
Here, the equation is not solved, but rather it is reduced to a general eigenvalue problem. Where λ = eigenvalues
[M][U]λ+[K][U]=[0]
The resulting eigenvalues are the frequencies of the structure while the eigenvectors are the mode shapes. A lower frequency or mode means less cycles per second and hence slower oscillation.
Results Display
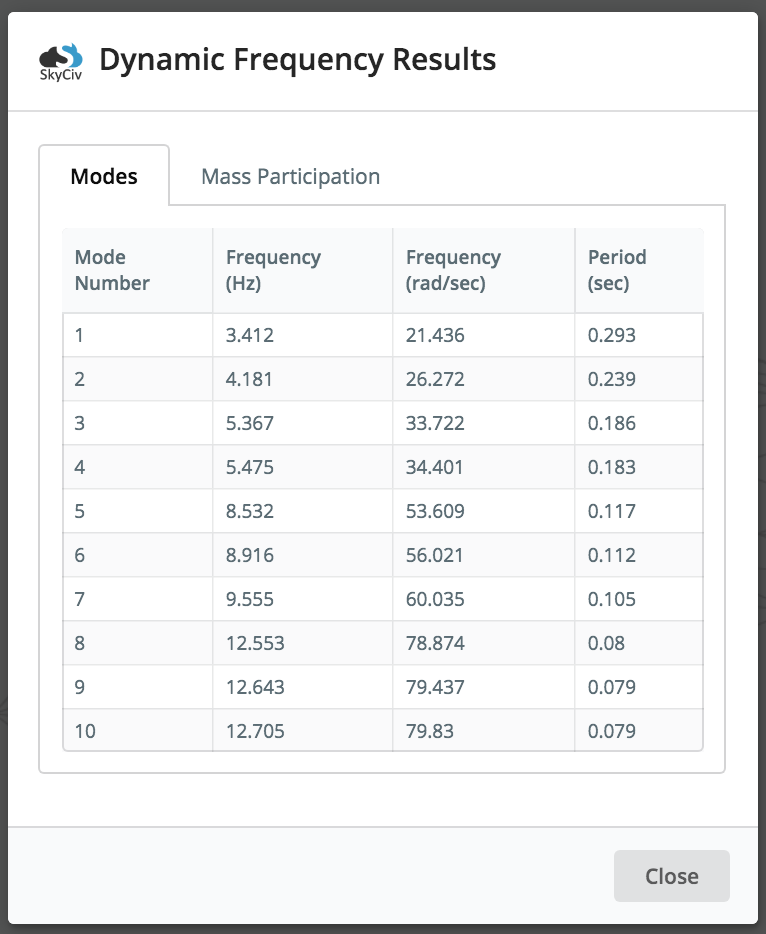
Once the Dynamic Frequency Analysis is completed, users can review the results of multiple mode shapes. Simply select the mode shape, and the structure will animate to show the mode shape. Users can also review the frequency and period values for all modes of the structure. Here’s an example of the animation and results:
Users are also provided with a tabulated set of results for each mode, including the natural frequency and period. So for instance, in the model above we have the frequency and period of each result (note for simplicity, only the first 10 modes were generated – this can be controlled under Settings):
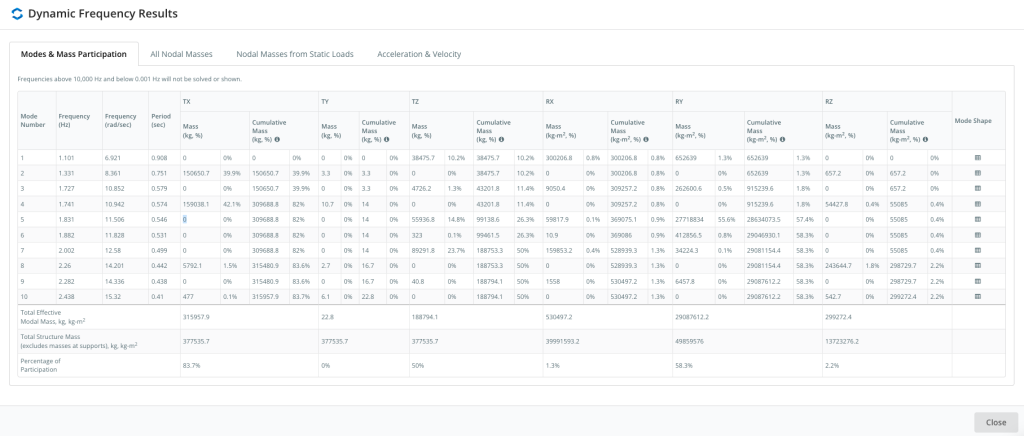
Additionally, the modal mass participation results of a structure, and its modes can be reviewed by clicking the Mass Participation tab. The mass participation factor represents the amount of mass associated with the specific frequency or mode of vibration. It essentially allows the user to see how much of the structure’s mass is excited with the given mode. Thereby giving insights on the structure’s response: the larger the mass participation factor, the larger it’s significance to the overall response.
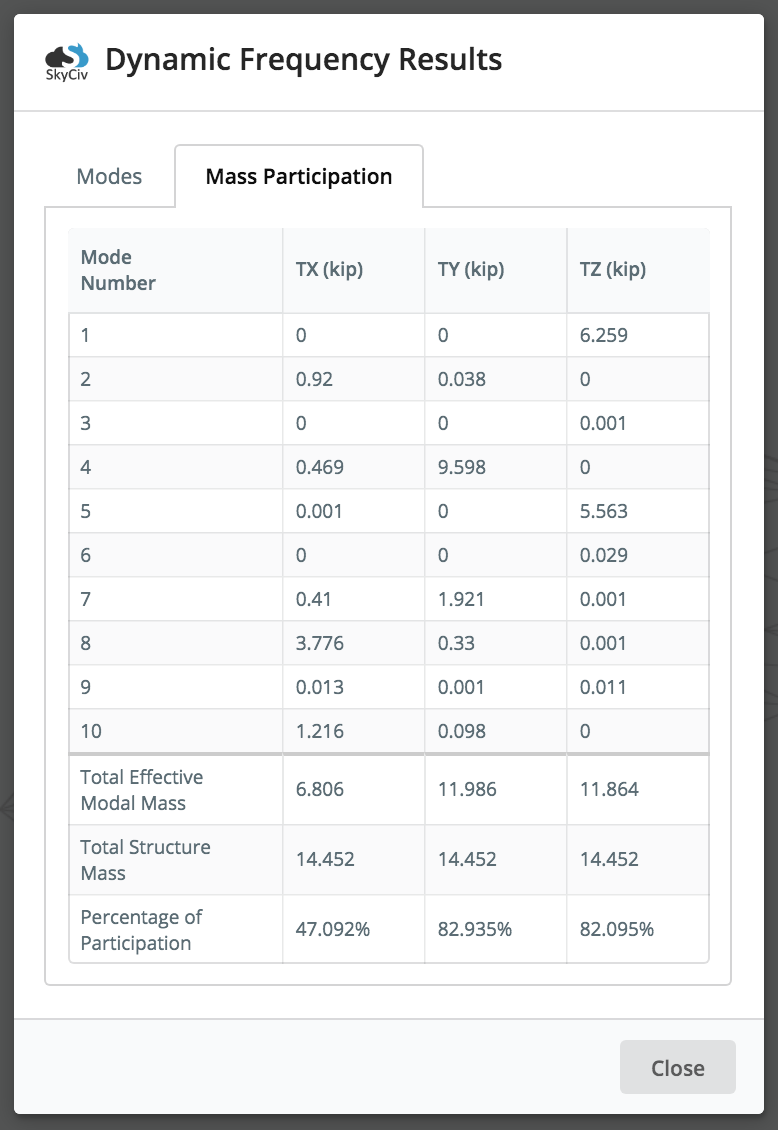
In the above sample animation (the bridge structure), you can see that the bridge moves/vibrates ONLY along x and y directions for this mode (Mode 2), so from that, we get 0 participation factors within the z direction (sideways). When dealing with relatively small mass participation factors, the user should always exercise engineering judgement and analyse the effects of these modes of vibration. Most building codes require at least 90% cumulative mass participation for analysis.
The latest version now provides a more comprehensive results tab for Dynamic Frequency Results.