Single pile design in accordance with ACI 318 (2014)
Piles are long and slender members which transfer the loads from the superstructure to deeper soil or onto a rock with adequate bearing capacity. Materials used for piles may include wood, steel, and concrete. Installation of the pile into the ground may be driven, drilled, or jacked which are then connected to pile caps. A lot of factors, such as site conditions, soil type, the transmission of loads, are considered to classify the type and installation of piles. This article shall focus on designing a concrete pile in accordance with the American Concrete Institute (ACI) 318 – 2014.
SkyCiv Foundation Design module includes the design of piles conforming to the American Concrete Institute (ACI 318) and Australian Standards (AS 2159 & 3600).
Want to try SkyCiv’s Foundation Design software? Our free tool allows users to perform load-carrying calculations without any download or installation!
Load carrying capacity of a pile
Generally, vertical loads applied on piles are carried by the end-bearing of the pile, and the skin-frictional resistance developed along its length. The ultimate load carrying capacity (QU) shall be represented by equation (1). A factor of safety is applied to compute for the allowable load-carrying capacity (QA).
\({Q}_{u} = {Q}_{p} + {Q}_{s}\) (1)
QU = Ultimate load-carrying capacity
QP = End-bearing Resistance
QS = Skin-frictional Resistance
\({Q}_{A} = \frac{{Q}_{U}}{FOS} \) (2)
QA = Allowable load-carrying capacity
FOS = Factor of safety
For a more detailed guide, check out our article on calculating the skin-frictional resistance and end-bearing capacity.
Structural strength of a single pile
Piles are also subjected to axial forces, shear force, and bending moment, which is why they are structurally designed similar to columns. Section 10.5.1.1 states that all factored load shall not exceed its corresponding design strengths.
\( {øP}_{N} ≤ {P}_{U} \) (3a)
\( {øM}_{N} ≤ {M}_{U} \) (3b)
\( {øV}_{N} ≤ {V}_{U} \) (3c)
PU, MU, VU = Factored axial, bending moment, shear loads
PN, MN, VN = Nominal axial, bending moment, shear loads
ø = Strength reduction factors (Table 1)
| Strength Reduction Factors(ϕ) | |||||||||||||
|---|---|---|---|---|---|---|---|---|---|---|---|---|---|
| Axial | 0.65-0.90 | ||||||||||||
| Flexural | 0.65-0.90 | ||||||||||||
| Shear | 0.75 | ||||||||||||
Table 1: Strength Reduction Factors (Table 21.2.1, ACI 318-14)
Shear capacity of a single pile (øVN)
Nominal shear strength shall be equivalent to combined contributions of the shear capacities of concrete and steel reinforcement.
Shear strength of concrete (Vc)
The contribution of concrete to the shear capacity is computed as shown on equation (4) which is defined on Section 22.5.5.1 of ACI 318-14.
\( {V}_{c} = 0.17 × λ × \sqrt{fc’} × b × d \) (4)
λ = Concrete modification factor = 1 (Normal weight concrete, Table 19.2.4.2)
fc’ = Strength of concrete
b = Pile width or diameter
d = 0.80 × pile depth (Section 22.5.2.2)
Shear strength of steel bars (Vs)
Lateral shear reinforcement’s contribution to the shear capacity is computed as the minimum between equations (5) and (6).
\( {V}_{s} = 0.066 × \sqrt{fc’} × b × d \) (5)
\( {V}_{s} = \frac{{A}_{v} × {f}_{yt} × d }{s} \) (6)
AV = Area of the shear reinforcing bars
fyt = Yield strength of the shear reinforcing bars
s = Center-to-center spacing of shear reinforcing bars
Nominal shear strength (øVN)
Summing up the output of equation 4-6 shall result to the nominal shear strength of the pile. Strength reduction factor (ø) shall be equal to 0.75 as defined in Table 22.2.1 of ACI 318-14.
\( {øV}_{N} = ø × ({V}_{c} + {V}_{s}) ≤ {øV}_{U} \) (7)
Axial and flexural capacities of a single pile (øPN, øMN )
Axial and flexural capacities are checked using an interaction diagram. This diagram is a visual representation of the behaviour of the bending and axial capacities caused by an increase in load from pure bending point until a balanced point is reached.
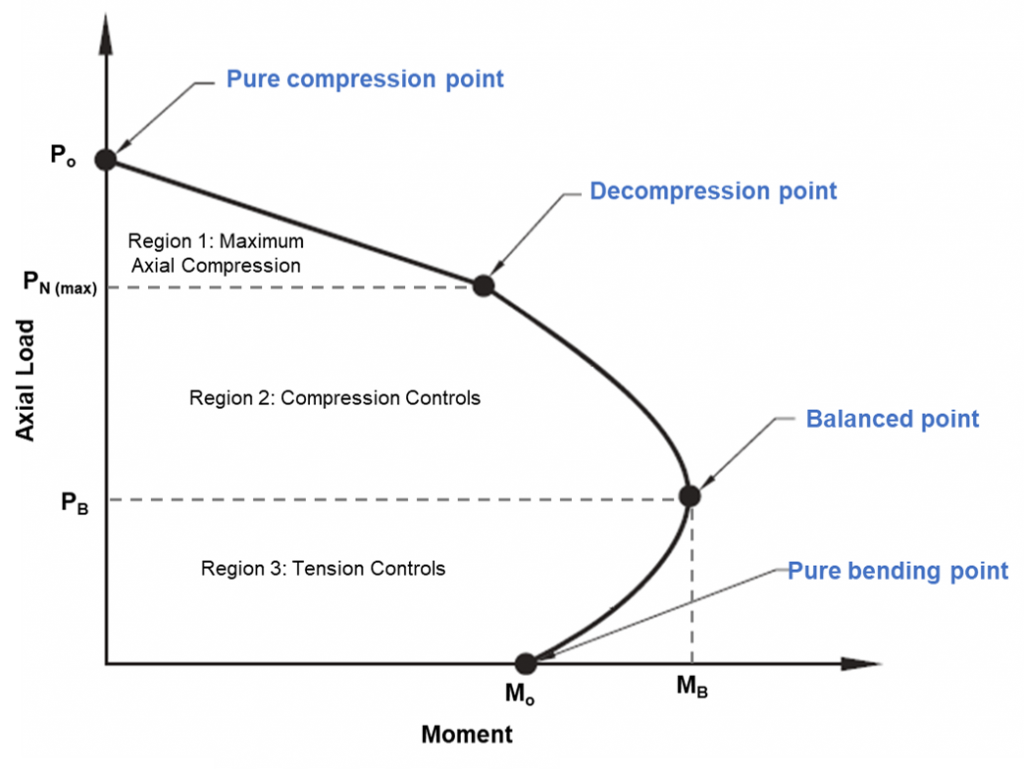
Figure 1: Column Interaction Diagram
Column interaction diagram
The pure compression point on the diagram is where the pile will fail compression purely. At this point, the axial load is applied to the plastic centroid of the section to remain in compression without bending. Strength of the pile between the pure compression point until decompression points can be calculated by linear interpolation. The decompression point is where the concrete strain at the extreme compressive fibre is equal to 0.003, and the strain in the extreme tensile fibre is zero. Pure bending point is where the axial load capacity is zero. Between the transition from decompression point to pure bending point, a balanced condition is achieved. At this point, the concrete strain is at its limit (εc=0.003), and the outer steel strain reaches yield (εs=0.0025). Any combination of axial load and bending moment outside the diagram will cause failure.
Maximum nominal axial compressive strength for design (øPN)
The design axial strength of a section shall only be limited to 80-85% of the nominal axial strength to account for accidental eccentricity.
\( {øP}_{N} = ø × {P}_{o} \) (8a)
\( {P}_{o} = F × [0.85 × {f}_{c} × ({A}_{g} – {A}_{st}) + ({f}_{y} × {A}_{st}) ] \) (8b)
F = 0.80 (Ties)
F = 0.85 (Spiral)
AG = Gross area of the pile cross-section
Ast = Total area of the longitudinal steel bars
fy = Yield strength of steel bars
Nominal flexural strength (øMN)
Construction of the interaction diagram for the column involves plotting a series of values of PN and MN. Values for PN shall be equivalent to the sum of the tensile and compressive forces, as shown in Figures 2a and 2b, while the corresponding MN is calculated by resolving these forces about the neutral axis. These forces include the compressive force acting on the compressive area and the forces exerted by each of the reinforcing bars which could either be compressive or tensile. A general procedure is suggested below to construct an interaction diagram using the equations presented.
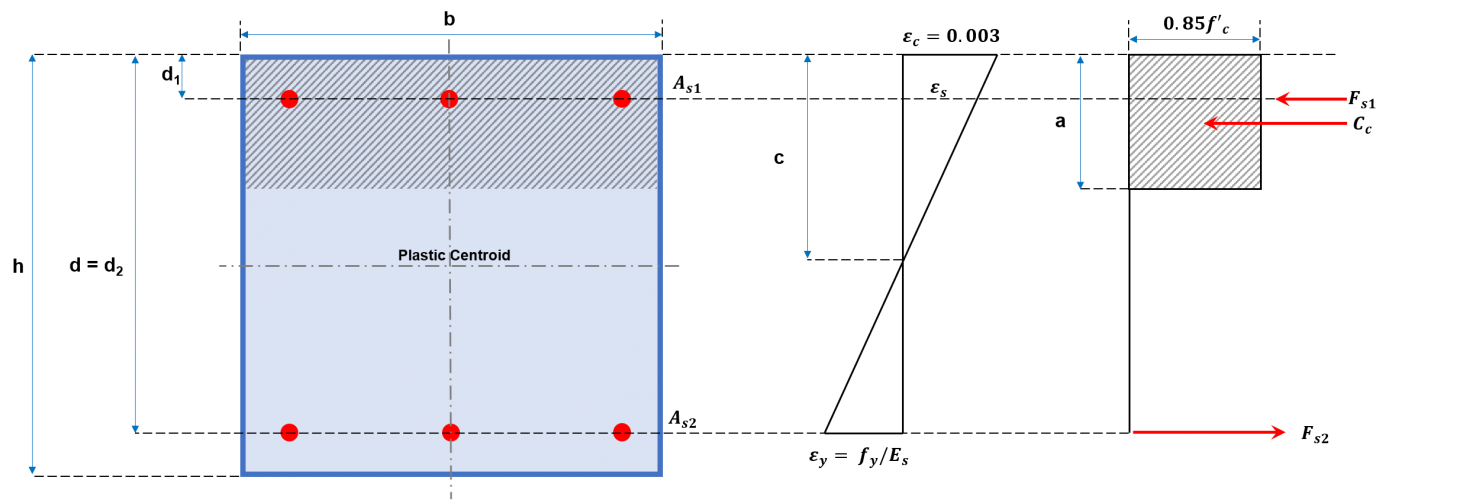
Figure 2a: Rectangular column cross-section
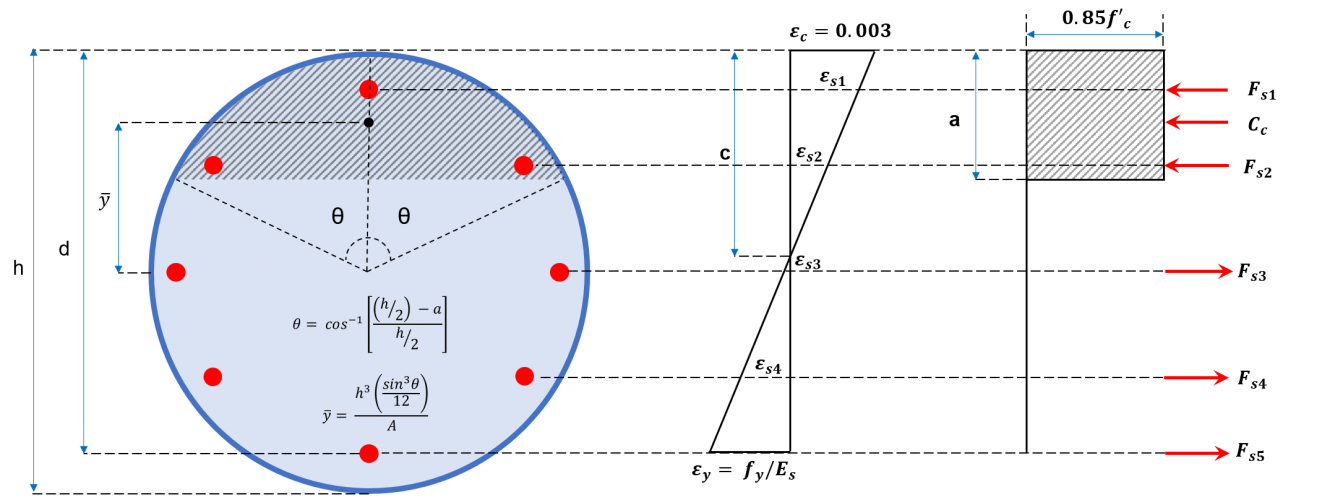
Figure 2b: Circular column cross-section
General procedure for interaction diagram of a column
(1) Compute for the value of Po and PN (equations 8a and 8b).
(2) Determine c and the strains in the reinforcements.
\( c = 0.003 × \frac{{d}_{1}}{0.003 + (Z + {ε}_{y})} \) (9)
c = Neutral axis depth
εy = Strain of steel = fy/Es
Z = Arbitrary value (0, -0.5, -1.0, -2.5)
A series of cases shall be considered by selecting various locations of the neutral axis, c. To set the locations of the neutral axis, different steel strains shall be selected by multiplying an arbitrary value Z to the yield strength of the steel. There is a wide range of values for Z. However, there are only four mandatory points to use for the interaction diagram.
- Z = 0: at this point, the strain at the extreme layer in tension is zero. This point marks the change from compression lap splice being allowed on all longitudinal bars to a tension lap splice.
- Z = -0.5: this strain distribution affects the length of tension lap splice in a column & is customarily plotted on an interaction diagram.
- Z = -1: this marks the point of a balanced condition. This strain distribution marks the change from compression failures originating by crushing of the compression surface of the section to tension failures initiated by the yield of the longitudinal reinforcement.
- Z = -2.5: this point corresponds to the tension controlled strain limit of 0.005.
(3) Compute for the stresses in the reinforcement layers.
\({f}_{si} ={ε}_{si} × {E}_{s} \) (10)
fsi = Stress in steel
εsi = Strain in steel
\({ε}_{si} = \frac{c -{d}_{i}}{c} × 0.003 \) (11)
Es = Modulus of elasticity of steel
(4) Determine the height of the compression stress block, a.
\(a = {β}_{1} × c \) (a ≤ h)(12)
For f’c ≤ 4000 psi (28 MPa):
β1 = 0.85
For f’c > 4000 psi (28 MPa):
\( {β}_{1} = 0.85 – \frac{0.05 × (f’c – 4000)}{1000} \) (Imperial)
\( {β}_{1} = 0.85 – \frac{0.05 ×(f’c – 28)}{7} \) (Metric)
(5) Compute for the forces in concrete and steel.
Area of the compressive stress block:
\({A}_{c} = a × b \) (Rectangular cross-section)
\({A}_{c} ={h}^{2} × \frac{θ – sinθ cosθ}{4} \) (Circular cross-section)
Compressive force in concrete:
\({C}_{c} = (0.85 × f’c) × {A}_{c}\) (14)
Tensile force in steel (di≤ a):
\({F}_{si} = {f}_{si} × {A}_{si} \) (15)
Compressive force in steel (di > a):
\({F}_{si} = [{f}_{si} – (0.85 × f’c)] × {A}_{si} \) (16)
(6) Calculate for the axial capacity (PN).
\({P}_{N} = {C}_{c} + Σ {F}_{si} \) (17)
(7) Calculate for the flexural capacity (MN).
\({M}_{N} = [{C}_{c} × (\frac{h}{2} – \frac{a}{2})]+ Σ [{F}_{si} × (\frac{h}{2} – {d}_{i}) \) (18)
(8) Compute for the value of the strength reduction factor (ø).
As shown in Table 1, the strength reduction factor for both axial and flexure varies from 0.60 to 0.90. Section 21.2 of ACI 318-14 demonstrates its value for the moment, axial force, or combined moment and axial force, as shown in Table 2 below.
| Classification | Spiral | Tied |
|---|---|---|
| Compression controlled | 0.75 | 0.65 |
| Transition from compression to tension | 0.75 + [50 × (εt – 0.003) ] | 0.65 + [(250/3) × (εt – 0.003) ] |
| Tension controlled | 0.90 | 0.90 |
Table 2: Strength Reduction Factors for Axial, moment or combine axial and moment (Table 21.2.2, ACI 318-14)
(9) Repeat steps 2-8 with various values for Z.
(10) Plot into the diagram the values of øPN and øMN.
Concrete Pile Design with SkyCiv Free Foundation Calculator
SkyCiv Free Foundation Calculator helps you with concrete pile design and other tasks such as footing and concrete piles design. Check it out now to explore how our calculator can help you with your concrete pile project!
References
-
- Building Code Requirements for Structural Concrete (2014). AC! 318-14 American Concrete Institute.
- Hsiao, J.K. (2012). Bending-Axis Effects on Load-Moment (P-M) Interaction Diagrams for Circular Concrete Columns Using a Limited Number of Longitudinal Reinforcing Bars. Electronic Journal of Structural Engineering 12 (1). Retrieved from http://www.ejse.org