A fully worked example of AS/NZS 1170.2 (2011) wind load calculations
SkyCiv’s wind load calculator now has several code references including the Australian/New Zealand Standards. In this article, we will be calculating the design wind pressure for a warehouse structure. We shall be using a model from our S3D to demonstrate how the loads (AS 1170.2/NZS1170.2:2011 ) are applied on each surface.
Take note that the example below is based on the 2011 version of the AS/NZS 1170.2. The procedures for the latest version may be different but should still be similar in calculation.
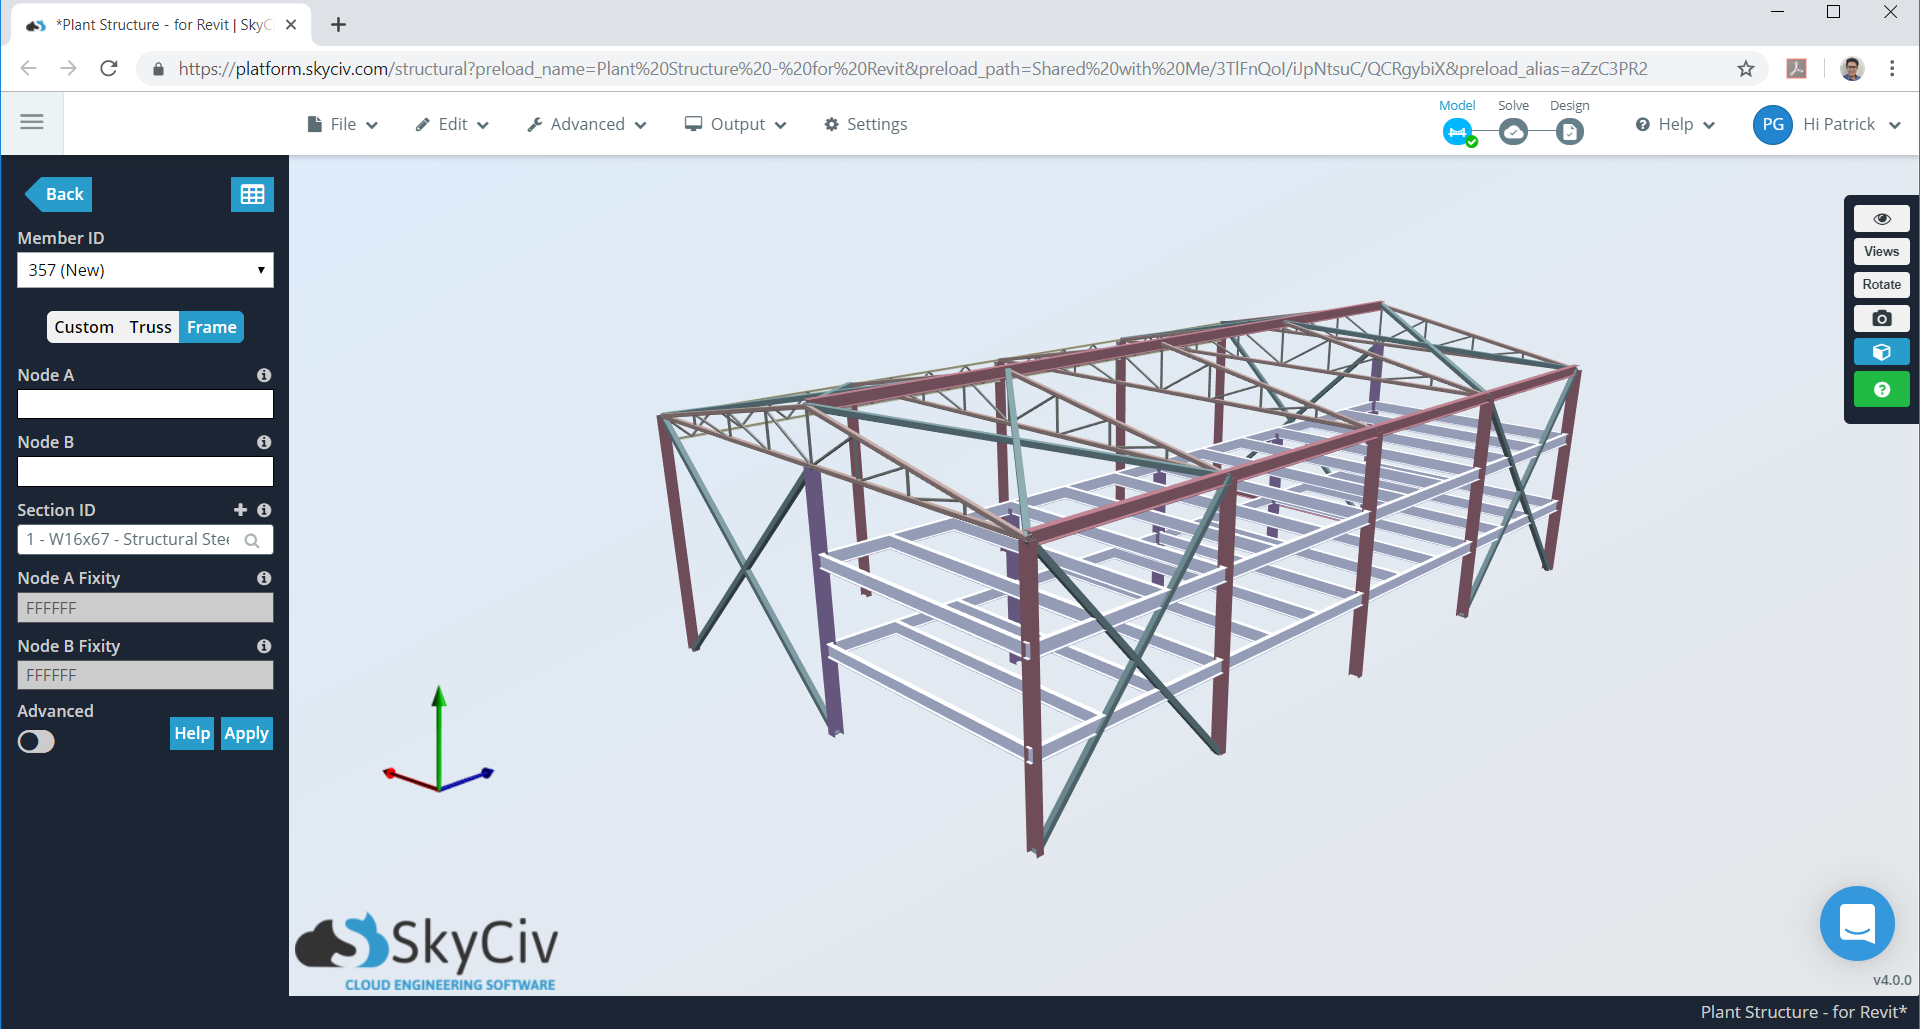
Figure 1. Warehouse model in SkyCiv S3D as example.
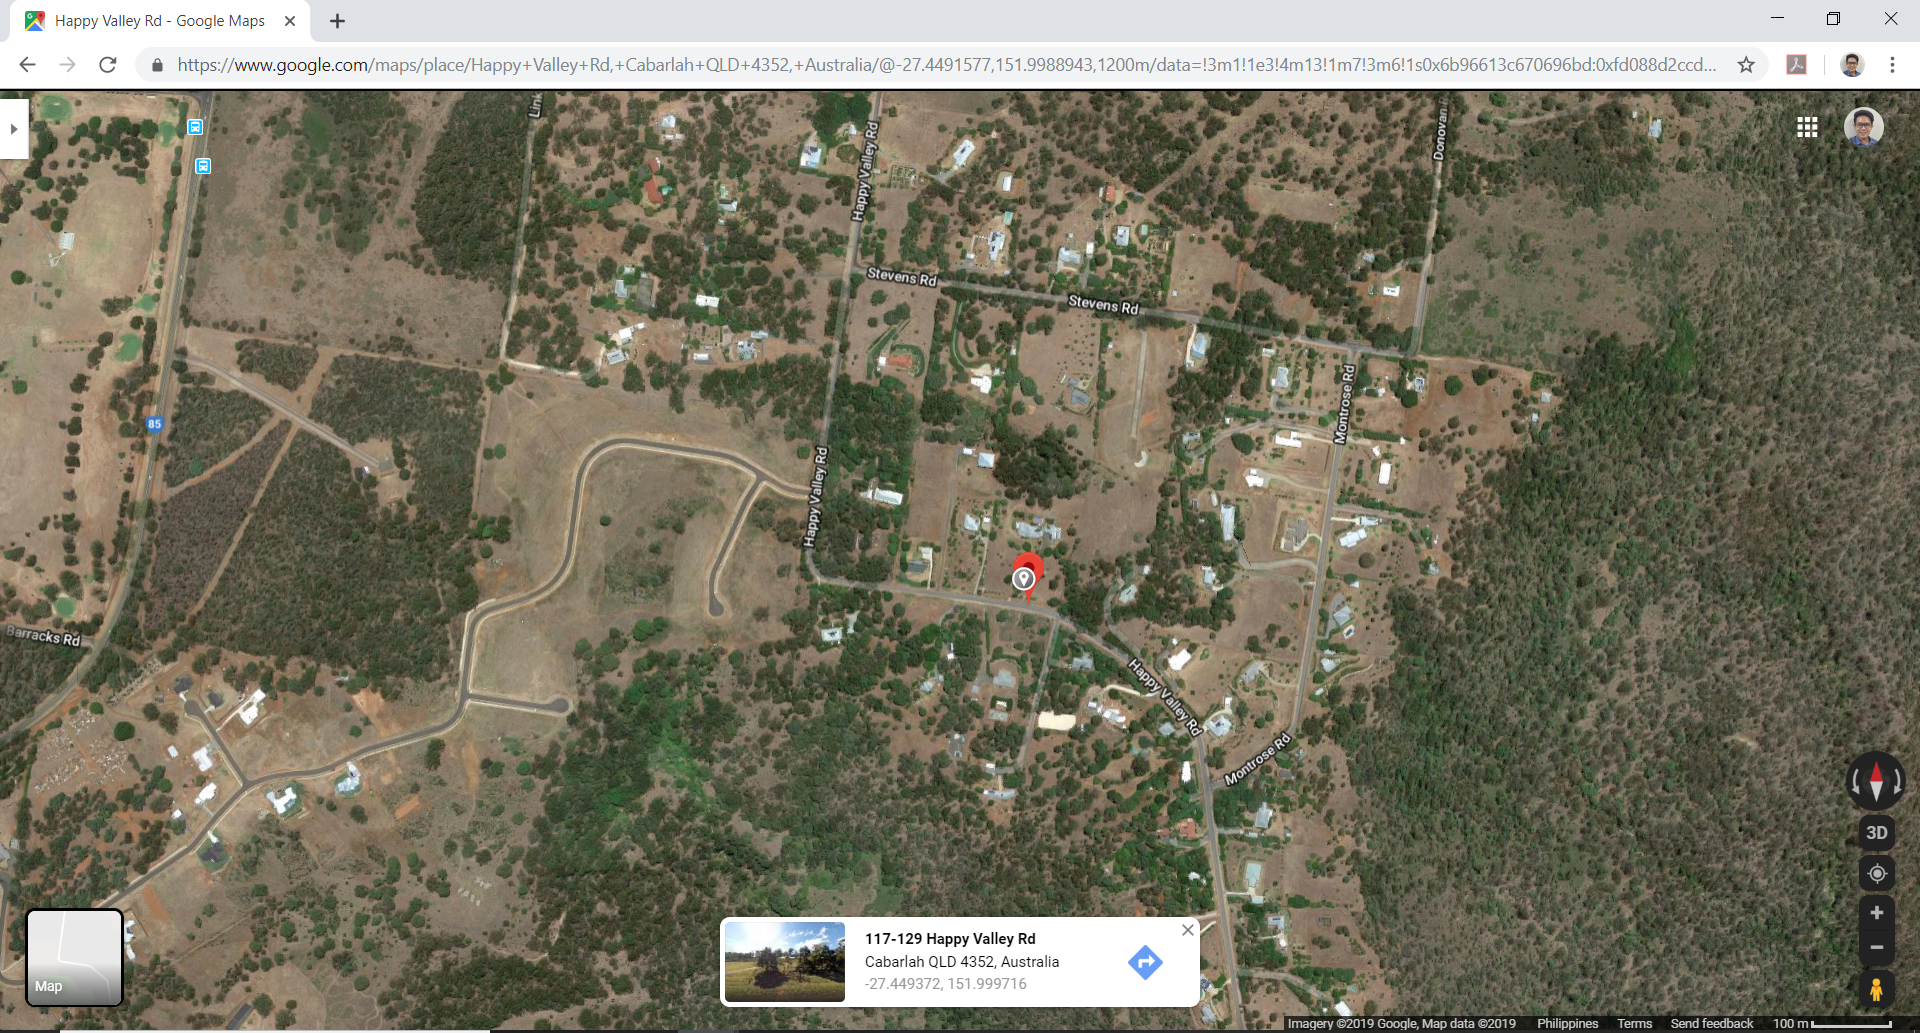
Figure 2. Site location (from Google Maps).
Table 1. Building data needed for our wind calculation.
| Location | Happy Valley Road, Cabarlah, Queensland, Australia |
| Occupancy | Miscellaneous – Warehouse Structure |
| Terrain | Flat farmland |
| Dimensions | 19.507 m (L) × 31.699 m (B) in plan Eave height of 9.144 m Apex height at elev. 10.973 m Roof slope 3:16 (10.62°) Without opening |
| Cladding | Purlins spaced at 0.6 m Wall studs spaced at 0.6 m |
The formula in determining the design wind pressure are:
For design wind speed:
\({V}_{sit,β} = {V}_{R} {M}_{d} {M}_{z,cat} {M}_{s} {M}_{t} \) (1)
Where:
\({V}_{sit,β}\) = design wind speed in m/s
\({V}_{R}\) = regional 3s gust wind speed (from wind map), m/s (AS/NZS 1170.2 Section 3)
\({M}_{d}\)= wind directional multiplier for 8 cardinal directions (β) (AS/NZS 1170.2 Section 3)
\({M}_{z,cat}\) = terrain/height multiplier (AS/NZS 1170.2 Section 4)
\({M}_{s}\)= shielding multiplier, set to 1.0 (AS/NZS 1170.2 Section 4)
\({M}_{t}\)= topographic multiplier (AS/NZS 1170.2 Section 3)
For design wind pressure:
\(p = 0.5 {⍴}_{air} ({V}_{des,θ})^2 {C}_{fig} {C}_{dyn} \) (2)
Where:
\(p\) = design wind pressure in Pa
\({⍴}_{air}\) = density of air (1.2 kg/cu.m.)
\({V}_{des,θ}\)= building orthogonal design wind speeds
\({C}_{dyn}\)= dynamic response factor, set to 1.0
\({C}_{fig}\) = aerodynamic shape factor (for internal or external pressure) for enclosed buildings where:
\({C}_{fig,i} = {C}_{p,i} {K}_{c,i} \) – for internal pressures (3)
\({C}_{fig,e} = {C}_{p,e} {K}_{a} {K}_{c,e} {K}_{l} {K}_{p}\) – for external pressures (4)
\({C}_{p,i}\) = internal pressure coefficient
\({K}_{c,i}\) = combination factor applied to internal pressures
\({C}_{p,e}\) = external pressure coefficient
\({K}_{a}\) = area reduction factor
\({K}_{c,e}\) = combination factor applied to external pressures
\({K}_{l}\) = local pressure factor
\({K}_{p}\) = porous cladding factor
Each parameter will be discussed in subsequently.
Regional Wind Speed, \({V}_{R}\)
Regional wind speed data is detailed in figure 3.1 of the AS/NZS 1170.2 (as shown in Figures 3 and 4 below). Each administrative area is classified into wind speed regions with corresponding wind speed. For our example, the site is located near the red dot and is classified as Region A4 since it is approximately 106 km from the smoothed Australia main island coastline. The corresponding wind speed can be calculated using table 3.1 of AS/NZS 1170.2 as shown in Figure 5. The annual recurrence interval is selected depending importance level and design working life of the structure as detailed in Table 3.3 of AS/NZS 1170.0.
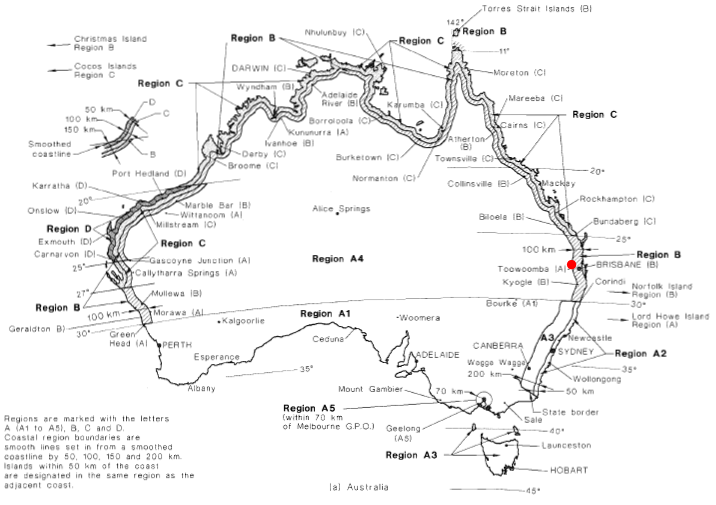
Figure 3. Regional wind speed map for Australia (Figure 3.1(A) of AS/NZS 1170.2).
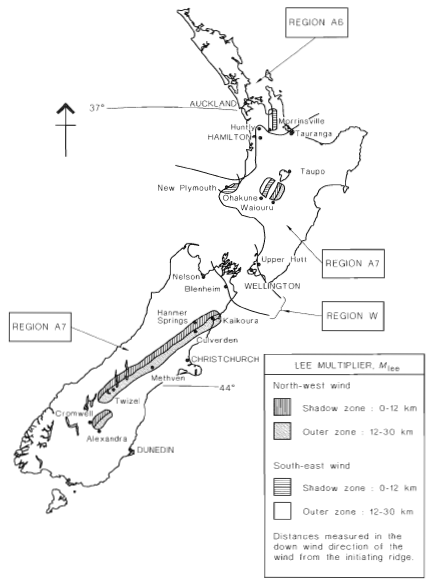
Figure 4. Regional wind speed map for New Zealand (Figure 3.1(B) of AS/NZS 1170.2).
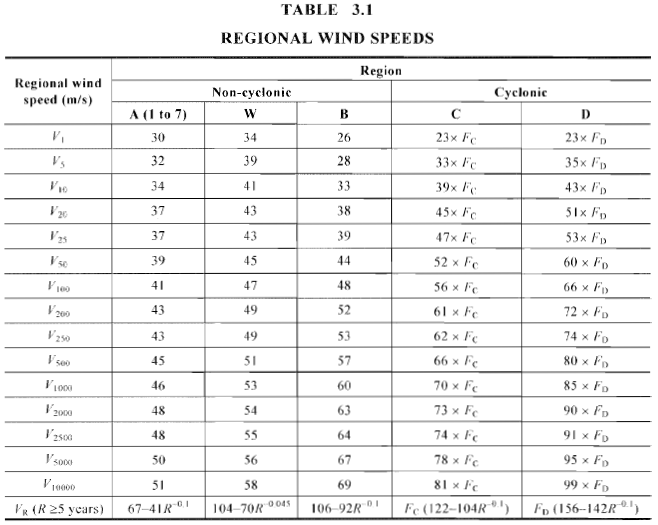
Figure 5. Corresponding wind speed based on wind region and annual recurrence interval (Table 3.1 of AS/NZS 1170.2).
For either ultimate or serviceability limit states, Tables 3.1 and 3.3 of AS/NZS 1170.0 (Figures 6 and 7) details how to classify the structure by importance level and its corresponding annual probability of exceedance.
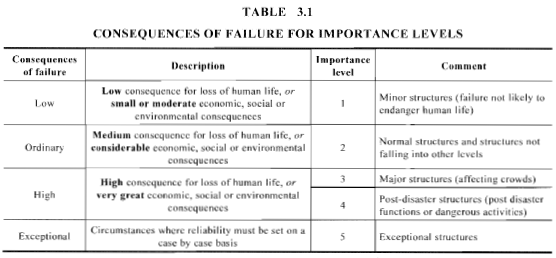
Figure 6. Definition of importance level according to Table 3.1 of AS/NZS 1170.0.
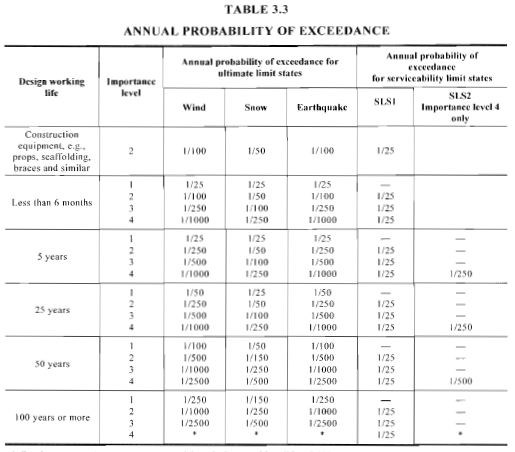
Figure 7. Definition of annual probability of exceedance according to Table 3.3 of AS/NZS 1170.0.
For our example, we shall only consider the ultimate limit state. Our example structure is classified to “Ordinary” and assumed to have design working life of 50 years. Hence, we shall adopt the annual probability of exceedance equivalent to 1/500. Hence, the corresponding value of our \({V}_{R}\) is 45 m/s.
SkyCiv now automates detection of wind region and getting the corresponding wind speed value with just a few input. Try our SkyCiv Free Wind Tool
Wind Direction Multiplier, \({M}_{d}\)
For each wind region and the corresponding direction of the wind (8 cardinal directions), wind direction multiplier, \({M}_{d}\), are different in values as shown in Table 3.2 of AS/NZS 1170.2.
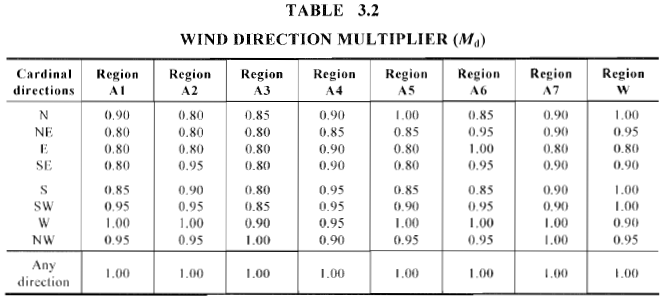
Figure 8. Wind direction multiplier values per wind region and direction according to Table 3.2 of AS/NZS 1170.2.
For this example, we shall check the wind speed coming from “NE” in which \({M}_{d}\) = 0.85. However, it is also safe to assume \({M}_{d}\) = 1.0 to give a conservative result.
Terrain/Height Multiplier, \({M}_{z,cat}\)
In order to calculate the terrain/height multiplier \({M}_{z,cat}\), we need to classify the terrain category of our site. Table 2 shows the definition of each terrain category based on Section 4.2.1 of AS/NZS 1170.2. \({M}_{z,cat}\) can now be calculated using Table 4.1 of AS/NZS 1170.2 depending on the height, wind region and terrain category of the structure.
Table 2. Terrain category definition for AS/NZS 1170.2.
| Terrain Category | Definition |
|---|---|
| Category 1 | Exposed open terrain with few or no obstructions and water surfaces at serviceability wind speeds |
| Category 2 | Water surfaces, open terrain, grassland with few, well-scattered obstructions having heights generally from 1.5 m to 10m |
| Category 3 | Terrain with numerous closely spaced obstructions 3 m to 5 m high, such as areas of suburban housing. |
| Category 4 | Terrain with numerous large, high (10 m to 30 m high) and closely spaced obstructions, such as large city centers and well-developed industrial complexes. |
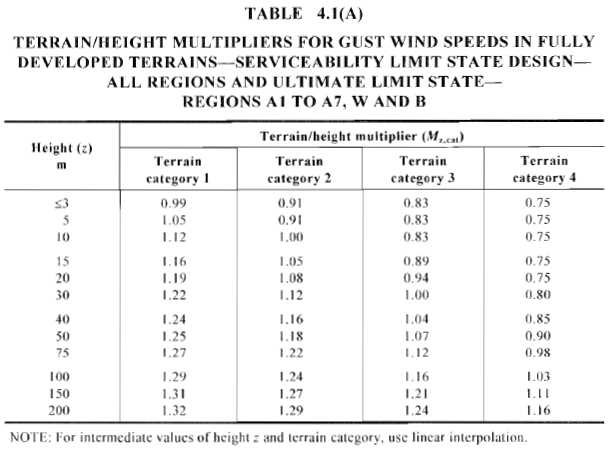
Figure 9. Calculated Terrain/Height Multiplier, \({M}_{z,cat}\) , based on corresponding terrain category and wind region (Table 4.1 of AS/NZS 1170.2).
For our example, the site location can be classified as “Category 2” assuming that we have a uniform terrain category for each wind direction. We shall divide the height of the structure for every 3m and the mean roof height. The tabulated values of \({M}_{z,cat}\) for each level is shown in Table 3.
Table 3. Calculated \({M}_{z,cat}\) for each level of the structure.
| Height, m | \({M}_{z,cat}\) |
|---|---|
| 3 m | 0.91 |
| 6 m | 0.928 |
| 9 m | 0.982 |
| 10.06 m | 1.001 |
Shielding Multiplier, \({M}_{s}\)
Shielding effect can be considered in calculating the design wind pressures using AS/NZS 1170.2. This is to consider decrease of wind pressure when nearby structures are present. Section 4.3 of AS/NZS 1170.2 details the calculation of the shielding factor \({M}_{s}\). For this example, since the site location is situated in an open field, and nearby structures have distance greater than 20h (201.2 m) from the structure, we can assume the \({M}_{s}\) = 1.0.
Topographic Multiplier, \({M}_{t}\)
Effect of topography on the wind pressure is captured in topographic multiplier, \({M}_{t}\), where it amplifies the design wind pressure based on the the ground elevation of the site, whether the structure is on a hill or escarpment. Section 4.4 of the AS/NZS 1170.2 details the calculation of this parameter. Outside the local topographic zone, a calculated distance from the peak of the hill or escarpment, the \({M}_{t}\) can be considered equal to 1.0 as shown in Figures 4.2 and 4.3 of AS/NZS 1170.2 (Figure 10).
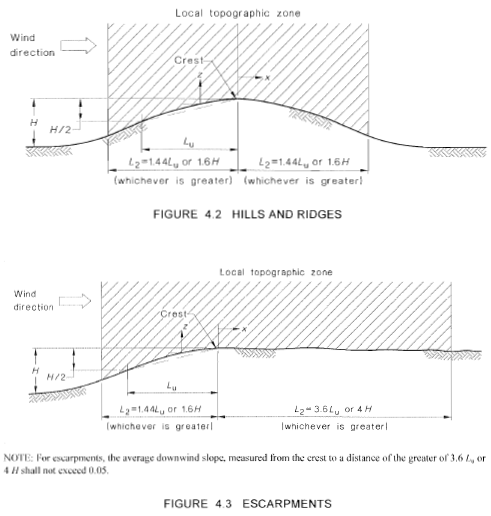
Figure 10. Parameters needed to calculate the topographic factor, \({M}_{t}\) , based on section 4.4 of AS/NZS 1170.2.
From the ground elevation data of the site (from Google Maps, coming from NE), we deduce that the topography can be classified as hill. Based on Figure 4.2 of AS/NZS 1170.2, the following points can be obtained as shown in Table 4:
Table 4. Extracted data points from ground elevation data (from Google Maps) as shown in Figure 11.
| Parameter | Value |
| Mt | 1.076 |
| slope | 0.07 |
| Location of peak | -380.00 m from location of structure |
| Elevation of peak | 628.16 m |
| Location of foot | -2000.00 m from location of structure |
| Elevation of foot | 515.37 m |
| H | 112.79 m |
| Loc. of H/2 | -1154.23 m from location of structure |
| x | 380.00 m |
| Lu | 774.23 m |
| L1 | 278.72 m |
| L2 | 1114.89 m |
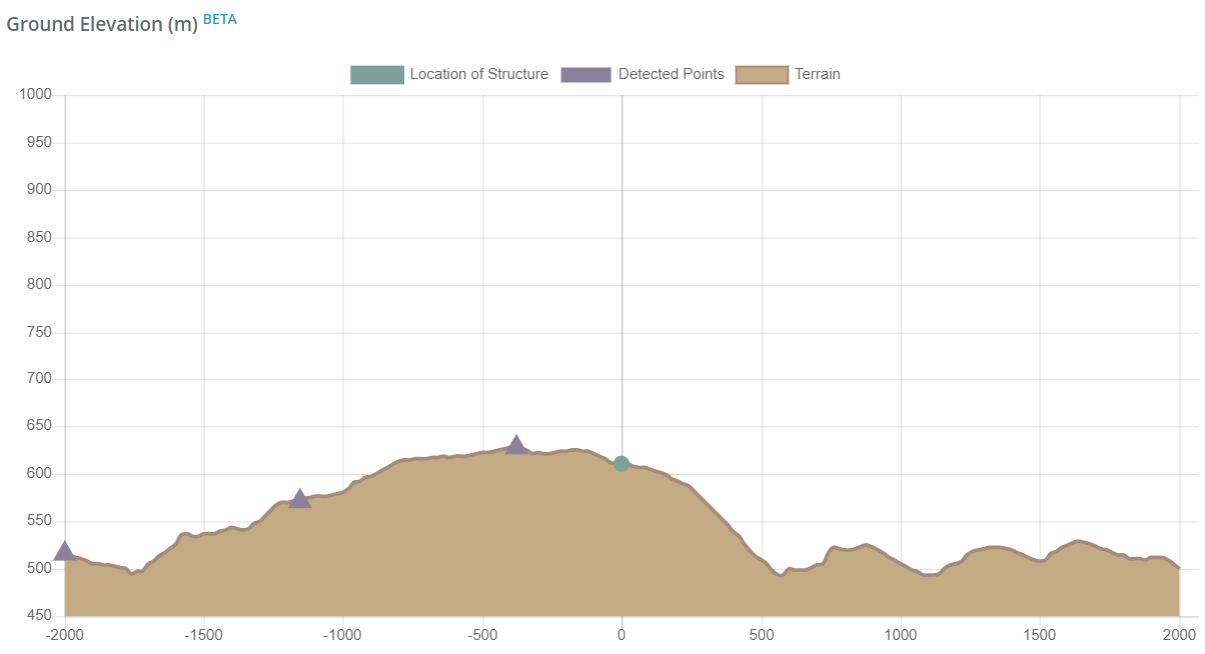
Figure 11. Ground elevation the site on NE-SW section (from Google Maps).
From the data shown in Table 4, the calculated topographic multiplier, \({M}_{t}\), is equal to 1.08 based on equation 4.4(2) of AS/NZS 1170.2 as shown in Equation (5).
\({M}_{t} = {M}_{h} = 1 + [ H / 3.5(z + {L}_{1})] [ 1 – ( |x| / {L}_{2})] \) (5)
\({M}_{t} = 1.08 \)
Finally, using Equation (1), the calculated design wind speed is shown in Table 5.
Table 5. Calculated \({V}_{sit,β}\) for each level of the structure.
| Height, m | \({V}_{sit,β}\), m/s |
| 3 | 37.45 |
| 6 | 38.19 |
| 9 | 40.42 |
| 10.06 | 41.20 |
Where:
\({V}_{sit,β (minimum)}\) = 30 m/s for permanent structures.
In order to calculate the design wind pressures, the aerodynamic shape factors, \({C}_{fig}\), for internal and external surfaces are needed. This will be discussed in the next section.
Aerodynamic Shape Factor, \({C}_{fig}\)
The aerodynamic shape factor, \({C}_{fig}\), is used to determine the values of wind pressure applied to each surface.A positive value of \({C}_{fig}\) means that the pressure is acting towards the surface while negative means acting away from the surface.
Aerodynamic Shape Factor for Internal Pressure, \({C}_{fig,i}\)
Internal Pressure Coefficient, \({C}_{p,i}\)
For \({C}_{fig,i}\), the calculation of internal pressure coefficient \({C}_{p,i}\) is detailed in Table 5.1 of AS/NZS 1170.2 as shown in Figure 12.
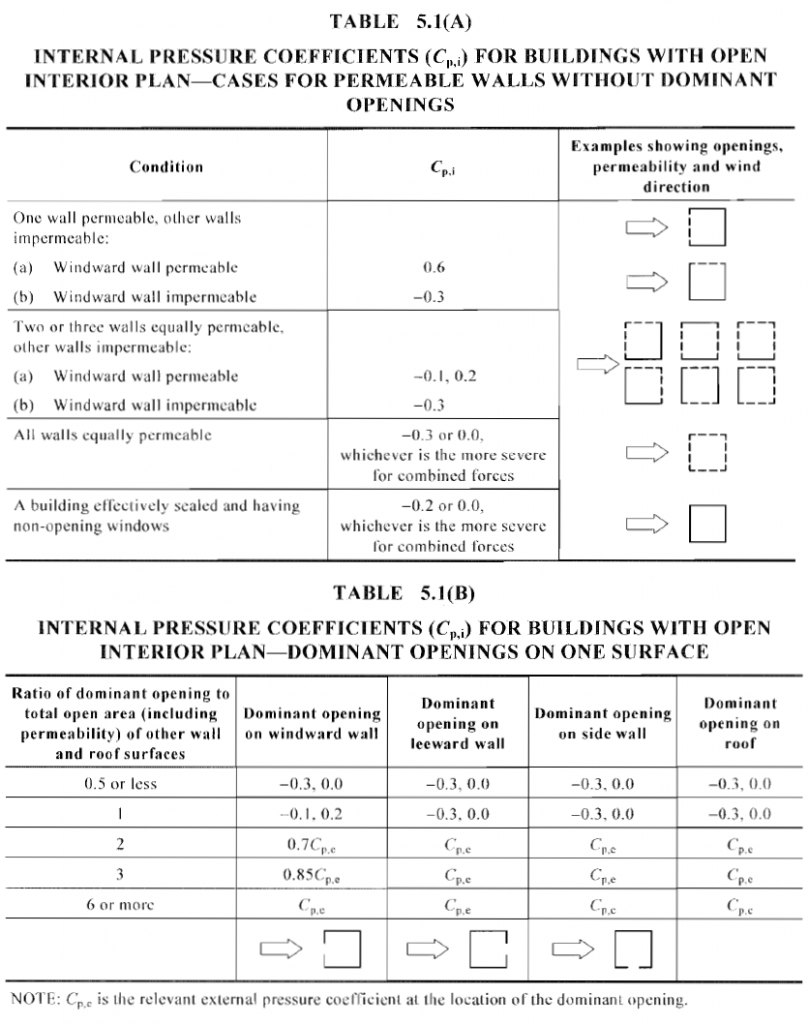
Figure 12. Internal pressure coefficient, \({C}_{p,i}\), as defined in Section 5.3 of AS/NZS 1170.2.
For this example, our structure is enclosed and assumed to have no opening, hence, the appropriate condition for this is structure is “A building effectively scaled and having non-opening windows” and the corresponding internal pressure coefficients are \({C}_{p,i}\) = -0.2, 0.0.
Aerodynamic Shape Factor for External Pressure, \({C}_{fig,e}\)
External Pressure Coefficient, \({C}_{p,e}\)
Section 5.4 of AS/NZS 1170.2 defines the procedure in getting the external pressure coefficient, \({C}_{p,e}\), for rectangular buildings. Building surfaces for external pressure distribution are defined in Figure 5.2 of the code as shown if Figure 13. Moreover, Tables 5.2 to 5.3 of AS/NZS 1170.2 details the calculated values of \({C}_{p,e}\) for each surface definition as shown in Figures 14 to 18.
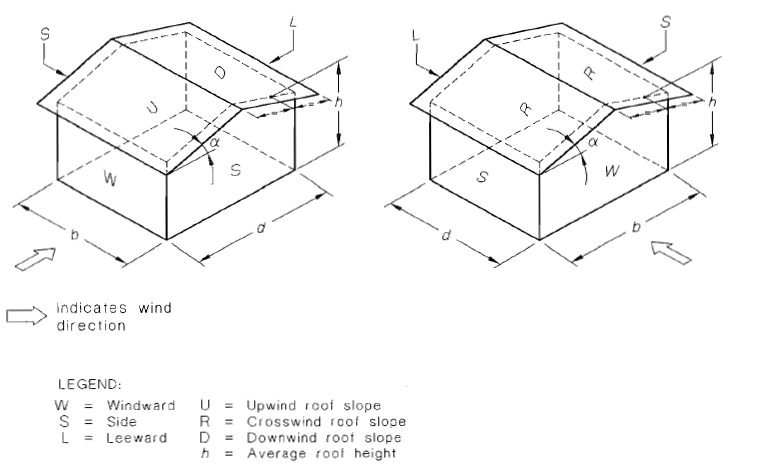
Figure 13. Surface definition for external pressure distribution, as defined in Section 5.4 of AS/NZS 1170.2.
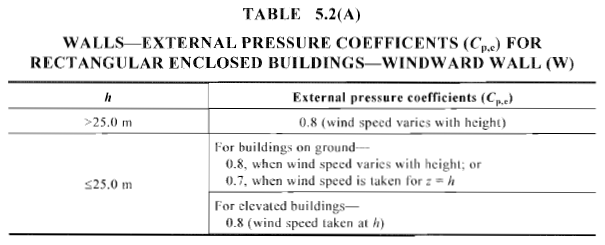
Figure 14. Calculated external pressure coefficient, \({C}_{p,e}\), for windward wall of rectangular enclosed buildings (Table 5.2(A) of AS/NZS 1170.2).
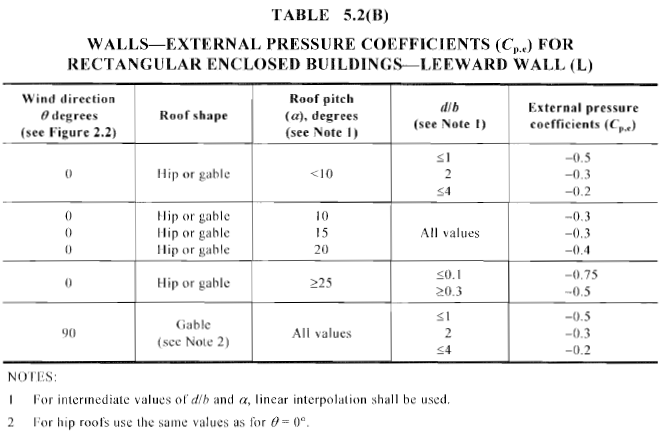
Figure 15. Calculated external pressure coefficient, \({C}_{p,e}\), for leeward wall of rectangular enclosed buildings (Table 5.2(B) of AS/NZS 1170.2).
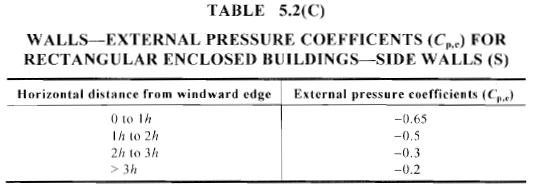
Figure 16. Calculated external pressure coefficient, \({C}_{p,e}\), for sidewalls of rectangular enclosed buildings (Table 5.2(C) of AS/NZS 1170.2).
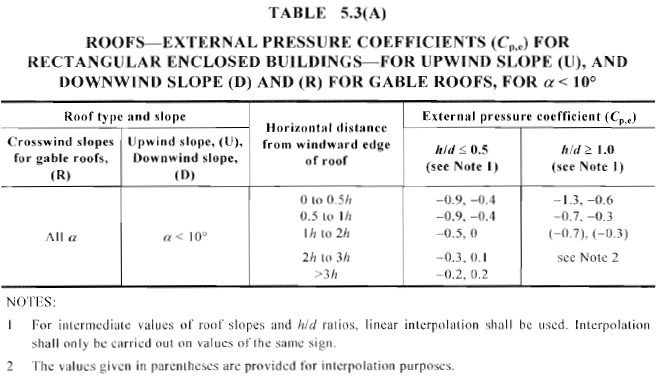
Figure 17. Calculated external pressure coefficient, \({C}_{p,e}\), for upwind and downwind surface of gable roof with pitch angle < 10° (Table 5.3(A) of AS/NZS 1170.2).
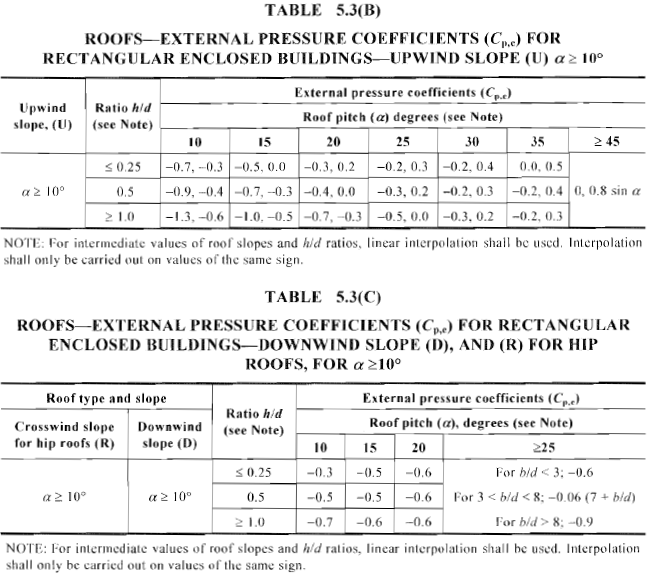
Figure 18. Calculated external pressure coefficient, \({C}_{p,e}\), for upwind and downwind surface of gable and hip roof with pitch angle ≥ 10° (Table 5.3(A) and Table 5.3(B) of AS/NZS 1170.2).
For this example, \({C}_{p,e}\) values for wall surfaces are shown in Table 6 and 7 below where \(d/b\) = 0.616 for 0° and \(b/d\) = 1.625 for 90° , \(h/d\) = 0.516, and \(h/b\) = 0.317 . Moreover, Table 8 shows the \({C}_{p,e}\) values for roof surfaces.
Table 6. Calculated external pressure coefficients, \({C}_{p,e}\), for windward and leeward wall surfaces.
| Height, m | \({C}_{p,e}\) (windward) | \({C}_{p,e}\) (leeward) – along L (0°) |
\({C}_{p,e}\) (leeward) – along B (90°) |
| 3 | 0.8 | -0.3 | -0.375 |
| 6 | 0.8 | ||
| 9 | 0.8 | ||
| 10.06 | 0.7 |
Table 7. Calculated external pressure coefficients, \({C}_{p,e}\), for sidewall surfaces.
| Location from windward wall, m | \({C}_{p,e}\) (sidewall) |
| 0 to 10.06m | -0.65 |
| 10.06 to 19.507 m | -0.50 |
Table 8. Calculated external pressure coefficients, \({C}_{p,e}\), for roof surfaces.
| Roof surface | \({C}_{p,e}\) |
| Upwind | -0.888, -0.394 |
| Downwind | -0.503 |
| Crosswind | -0.9, -0.4 (0 to h) -0.5, 0.0 (h to 2h) -0.3, 0.1 (2h to 3h) -0.2, 0.2 (> 3h) |
Area Reduction Factor, \({K}_{a}\)
Area reduction factor, \({K}_{a}\), is only applicable to side walls and roof surfaces. Otherwise calculated, \({K}_{a}\) is always equal to 1.0. Table 5.4 of AS/NZS 1170.2 shows the value of \({K}_{a}\) depending on the contributing area for side walls and roof surfaces as shown in Figure 19.
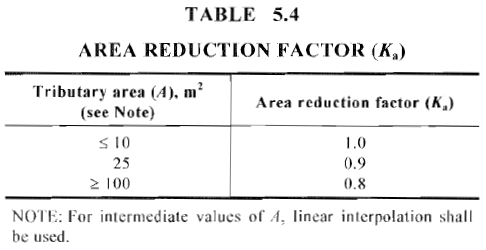
Figure 19. Values of area reduction factor, \({K}_{a}\), for side walls and roof surfaces (Table 5.4 of AS/NZS 1170.2).
For our example, the calculated values of area reduction factor are shown in Table 9 below.
Table 9. Values of area reduction factor, \({K}_{a}\), for this example.
| Surface | Area, sq.m. | \({K}_{a}\) |
| sidewall (along d) | 196.21 | 0.8 |
| sidewall (along b) | 285.29 | 0.8 |
| roof – windward | 314.564 | 0.8 |
| roof – leeward | 314.564 | 0.8 |
| roof – crosswind | 629.129 | 0.8 |
Local Pressure Factor for Claddings, \({K}_{l}\)
The local pressure factor, \({K}_{l}\), is always equal to 1.0 to all surfaces except for components and claddings. Section 5.4.4 of AS/NZS 1170.2 details the calculation procedure in getting \({K}_{l}\) for these components.
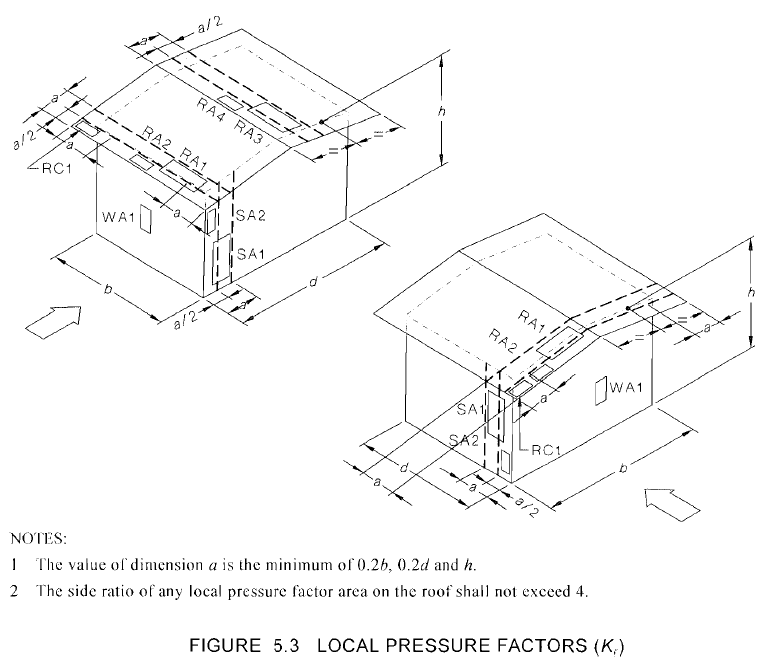
Figure 20. Location of cladding pressures as defined in Table 5.6 of AS/NZS 1170.2.
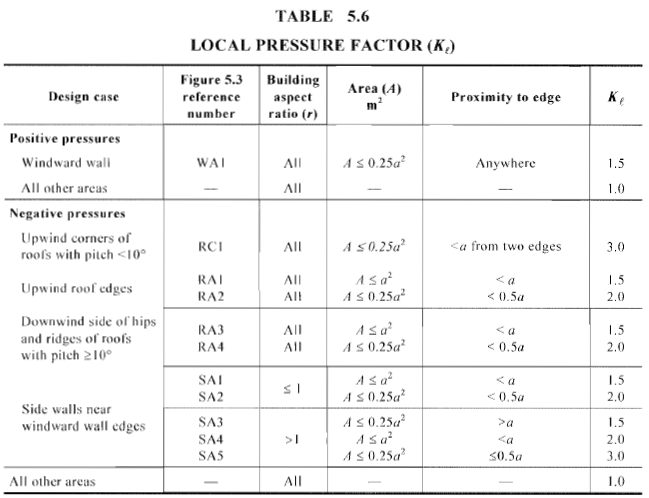
Figure 21. Values of local pressure factor, \({K}_{l}\), for each zones as shown in Figure 20.
For this example, the values of \(a\) is the minimum of \(0.2b\) (3.91 m), \(02.d\) (6.34 m), or \(h\) (10.06m), hence, \(a\) = 3.91 m. The corresponding area and local pressure factor for purlins and wall studs are shown in Table 10 below with the assumption that span length of purlin is equal to the spacing of trusses (7.924 m) and span length of wall studs is equal to the story height (3 m). Building aspect ratio is the largest of \(h/d\) (0.516) and \(h/b\) (0.317).
Table 10. Values of local pressure factor \({K}_{l}\) for purlins and wall studs.
| Cladding | Area, sq.m. | Zones | Kl for positive pressure | Kl for negative pressure |
| purlin | 4.75 | RA1 | 1.0 | 1.5 |
| RA3 | 1.0 | 1.5 | ||
| wall studs | 1.80 | WA1 | 1.0 | 1.0 |
| SA1 | 1.0 | 1.5 | ||
| SA2 | 1.0 | 2.0 |
Permeable Cladding Reduction Factor, \({K}_{p}\), for roofs and side walls
The permeable cladding reduction factor, \({K}_{p}\), is always equal to 1.0 to all surfaces except that an external surface consists of permeable cladding and the solidity ratio is less than 0.999 where solidity ratio is the ratio of solid area to total surface area. For this example, we shall assume that \({K}_{p}\) is equal to 1.0.
Action Combination Factors, \({K}_{c,i}\) and \({K}_{c,e}\)
Action combination factors, \({K}_{c,i}\) and \({K}_{c,e}\), are used to calculate the effect of the wind load simultaneously acting on specific surfaces (such as wind acting on walls, roofs, and internal pressures). Table 5.5 of the AS/NZS 1170.2 shows examples of action combination with their corresponding action combination factors as illustrated in Figure 22.
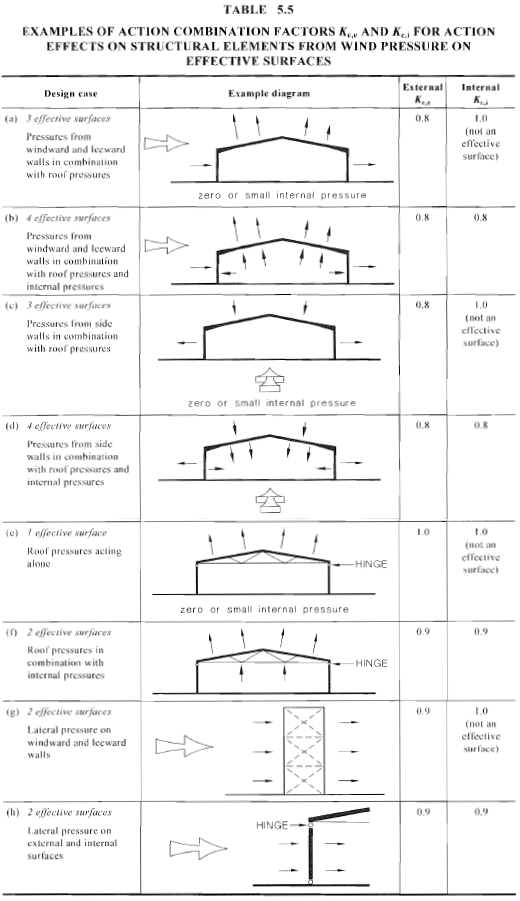
Figure 22. Action combination factors \({K}_{c,e}\) and \({K}_{c,i}\) from Table 5.5 of AS/NZS 1170.2.
For this example, we shall consider design case (b) where 4 effective surfaces are loaded with design pressures. Hence, \({K}_{c,i}\) and \({K}_{c,e}\) are both equal to 0.8.
Design Wind Pressures for Main Frame
Since we already have the necessary parameters, \(p\), we can obtain the design wind pressure values using Equations (2) to (4). Tables 11 to 13 show the summary of parameters for each surface.
Table 11. Design pressure values for windward wall.
| height, m | \({M}_{z,cat}\) | \({V}_{des,θ}\) | \({C}_{fig}\) | \({C}_{p,e}\) | \({K}_{a}\) | \({K}_{c,e}\) | \({K}_{l}\) | \({K}_{p}\) | Design Pressure \(p\), Pa |
| 3 | 0.910 | 37.45 | 0.640 | 0.8 | 1 | 0.8 | 1 | 1 | 538.64 |
| 6 | 0.928 | 38.19 | 0.640 | 0.8 | 1 | 0.8 | 1 | 1 | 560.16 |
| 9 | 0.982 | 40.42 | 0.640 | 0.8 | 1 | 0.8 | 1 | 1 | 627.25 |
| 10.06 | 1.001 | 41.20 | 0.560 | 0.7 | 1 | 0.8 | 1 | 1 | 570.29 |
Table 12. Calculated design pressure values for leeward and side walls, and roof surfaces.
| Surface | \({V}_{des,θ}\) | \({C}_{fig}\) | \({C}_{p,e}\) | \({K}_{a}\) | \({K}_{c,e}\) | \({K}_{l}\) | \({K}_{p}\) | Design Pressure \(p\), Pa |
| Leeward wall | 41.20 | -0.24 | -0.3 | 1 | 0.8 | 1 | 1 | -244.41 |
| Sidewall (0 to 10.06m) |
-0.520* | -0.65 | 0.8 | 0.8 | 1 | 1 | -529.55 | |
| Sidewall (0 to 10.06m) |
-0.400* | -0.5 | 0.8 | 0.8 | 1 | 1 | -407.35 | |
| Roof (upwind) |
-0.710* | -0.888 | 0.80 | 0.8 | 1.0 | 1.0 | -723.13 | |
| -0.315* | -0.394 | 0.80 | 0.8 | 1.0 | 1.0 | -320.99 | ||
| Roof (downwind) |
-0.402* | -0.503 | 0.80 | 0.8 | 1.0 | 1.0 | -409.79 | |
| Roof (crosswind) |
-0.720* -0.400* -0.240* -0.160* |
-0.90 -0.50 -0.30 -0.20 |
0.80 0.80 0.80 0.80 |
0.8 0.8 0.8 0.8 |
1.0 1.0 1.0 1.0 |
1.0 1.0 1.0 1.0 |
-733.23 (0 to h) -407.35 (h to 2h) -244.41 (2h to 3h) -162.94 (> 3h) |
Table 13. Calculated internal wind pressures simultaneously acting with external pressures.
* – product of \({K}_{a}\) and \({K}_{c,e}\) shall not be less than 0.8 (Section 5.4.3 of AS/NZS 1170.2).
| Surface | \({V}_{des,θ}\) | \({C}_{fig,i}\) | \({C}_{p,i}\) | \({K}_{c,i}\) | Design Pressure \(p\), Pa |
| Internal pressure | 41.20 | 0.0 | 0.0 | 0.8 | 0.0 |
| 41.20 | -0.16 | -0.2 | 0.8 | -162.94 |
To summarize the design pressures are shown in Table 14 and 15 combining the effect of external and internal pressure action.
Table 14. Calculated design wind pressures for windward wall.
| height, m | External Pressure \({p}_{e}\), Pa | Internal Pressure, Pa | Combined Pressure, Pa | ||
| \({p}_{i,max}\) | \({p}_{i,min}\) | \({p}_{e}-{p}_{i,max}\) | \({p}_{e}-{p}_{i,min}\) | ||
| 3 | 538.64 | 0.00 | -162.94 | 538.64 | 701.58 |
| 6 | 560.16 | 0.00 | -162.94 | 560.16 | 723.10 |
| 9 | 627.25 | 0.00 | -162.94 | 627.25 | 790.19 |
| 10.06 | 570.29 | 0.00 | -162.94 | 570.29 | 733.23 |
Table 15. Calculated design wind pressures for other surfaces.
| Surface | External Pressure \({p}_{e}\), Pa | Internal Pressure, Pa | Combined Pressure, Pa | ||
| \({p}_{i,max}\) | \({p}_{i,min}\) | \({p}_{e}-{p}_{i,max}\) | \({p}_{e}-{p}_{i,min}\) | ||
| Leeward wall | -244.41 | 0.00 | -162.94 | -244.41 | -81.47 |
| Sidewall (0 to 10.06m) | -529.55 | 0.00 | -162.94 | -529.55 | -366.61 |
| Sidewall (10.06 to 19.507m) | -407.35 | 0.00 | -162.94 | -407.35 | -244.41 |
| Roof (upwind) | -723.13 | 0.00 | -162.94 | -723.13 | -560.19 |
| -320.99 | 0.00 | -162.94 | -320.99 | -158.05 | |
| Roof (downwind) | -409.79 | 0.00 | -162.94 | -409.79 | -246.85 |
| Roof (crosswind) | -733.23 (0 to h) -407.35 (h to 2h) -244.41 (2h to 3h) -162.94 (> 3h) |
0.00 | -162.94 | -733.23 (0 to h) -407.35 (h to 2h) -244.41 (2h to 3h) -162.94 (> 3h) |
-570.29 (0 to h) -244.41 (h to 2h) -81.47 (2h to 3h) 0 (> 3h) |
Since the spacing of each frame is equal to 7.925m, considering one frame, the equivalent distributed wind loads acting on the frame are shown in Figures 23 and 24. Take note that we shall have two load cases to be considered, and maximum absolute values of roof upwind pressure are taken into account for each case.
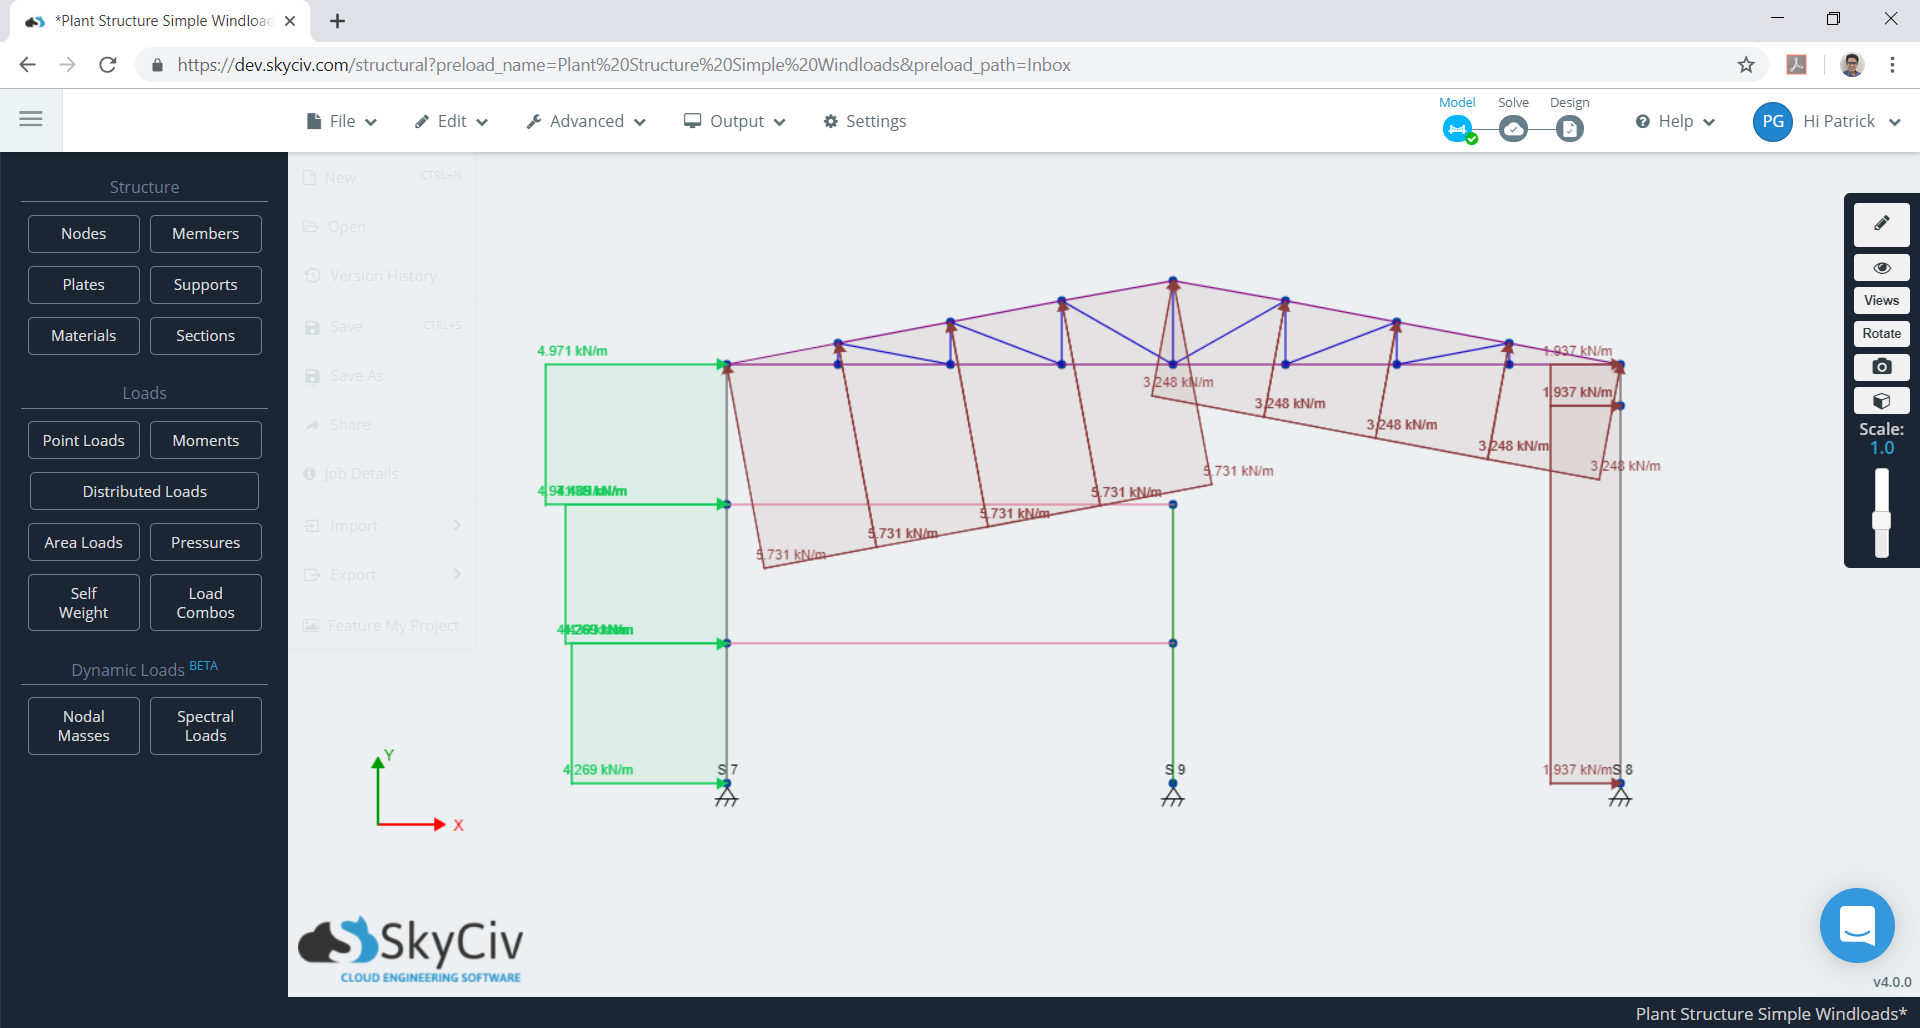
Figure 23. Equivalent design wind pressures for one frame (case 1).
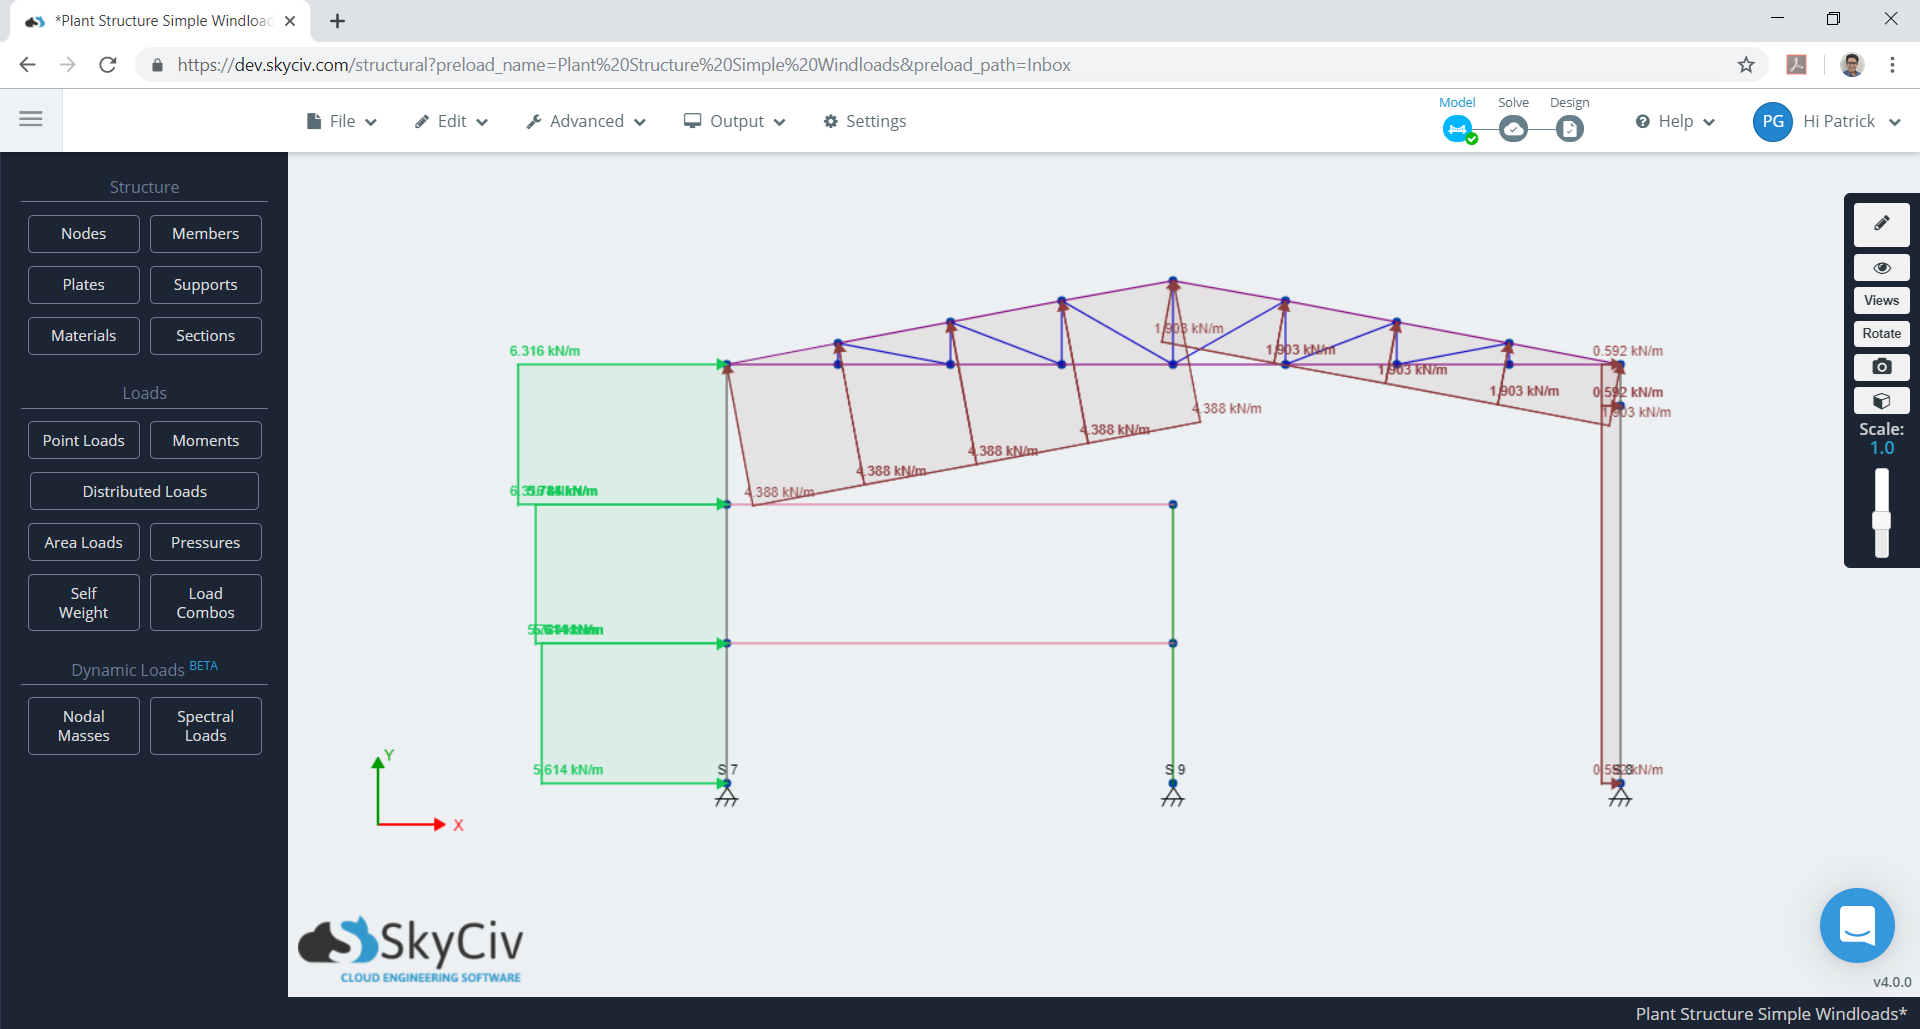
Figure 24. Equivalent design wind pressures for one frame (case 2).
These calculations can be all be performed using SkyCiv’s Wind Load Software for ASCE 7-10, 7-16, EN 1991, NBBC 2015, AS 4055 and AS 1170. Users can enter in a site location to get wind speeds and topography factors, enter in building parameters and generate the wind pressures. With a Professional Account, users can auto apply this to a structural model and run structural analysis all in the one software.
Otherwise, try our SkyCiv Free Wind Toolor book a FREE DEMO to get assisted with your engineering projects for existing users

Structural Engineer, Product Development
MS Civil Engineering
References:
- Joint Technical Committee. (2011). AS/NZS 1170.2: 2011 Structural design actions-Part 2: Wind actions. Australian/New Zealand Standard (AS/NZS), Joint Technical Committee BD-006, Australia/New Zealand.