In this article, we will walk you through the how to determine the terrain or exposure categories of the upwind side the site location, which are essential for calculating wind loads. We will cover the specific procedures outlined in ASCE 7, NBCC 2015, and AS/NZS 1170.2 for determining the terrain categories and discuss how these apply to each reference code available in the SkyCiv Load Generator.
ASCE 7-16/ASCE 7-22
For ASCE 7, the procedure to determine the Exposure Category of the upwind exposure of a site location is discussed in Section 26.7, depending on the terrain. In this article, to simplify the reference, we shall be using ASCE 7-16. For each wind source direction, it should be analyzed from two upwind sectors extending ±45°.
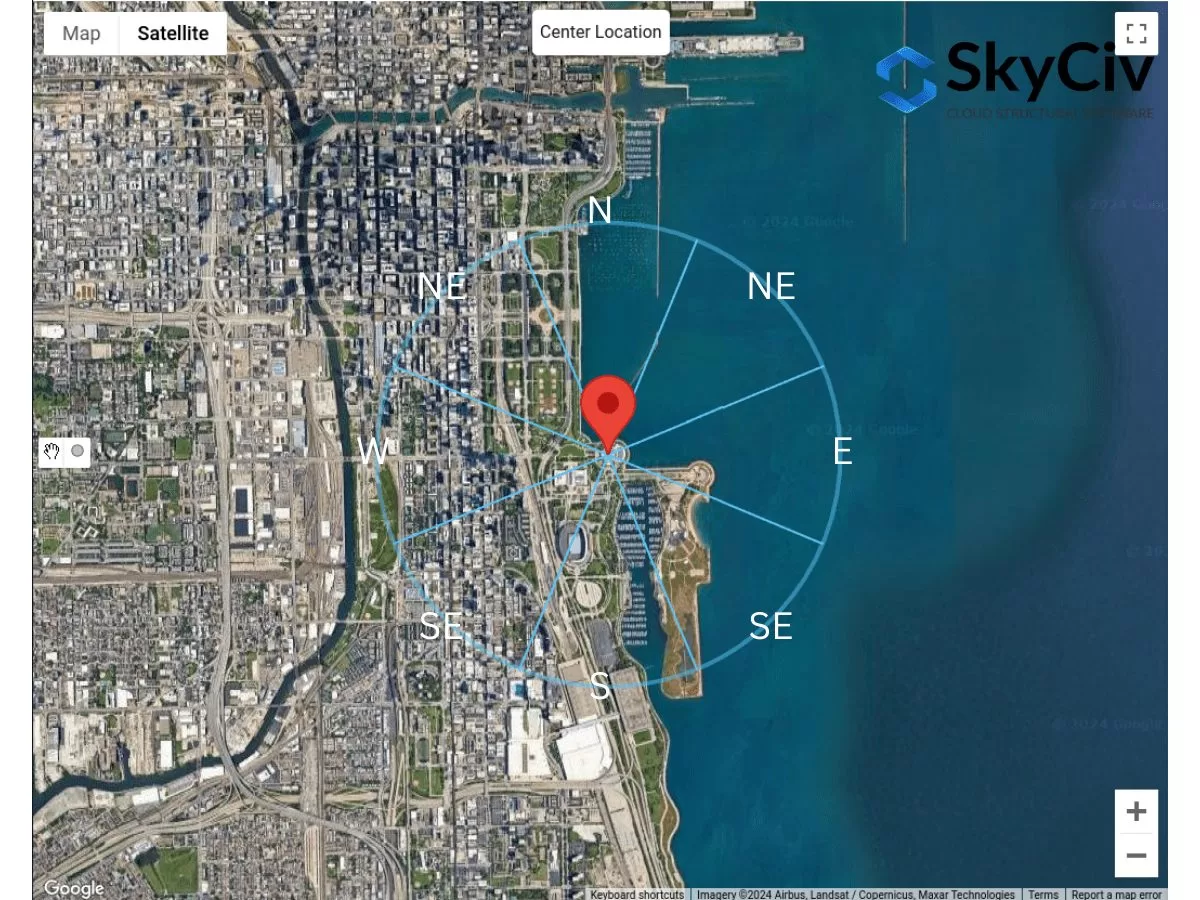
Figure 1. Terrain sectors for each wind source direction.
For each sector, the Surface Roughness category should be checked based on the following definition based on Section 26.7.2 of ASCE 7-16:
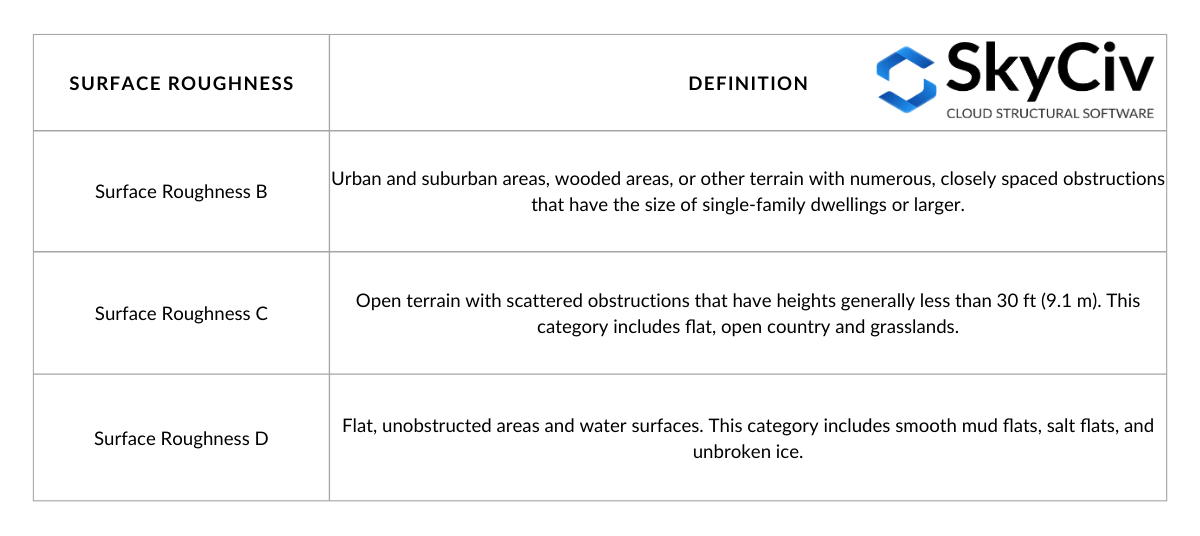
Table 1. Surface Roughness definition based on Section 26.7.2 of ASCE 7-16.
From the definition of Surface Roughness, we can determine the Exposure Category of the terrain bounded by the upwind sector. The definition for each Exposure Category is stated in Section 26.7.3 of ASCE 7-16 as follows:
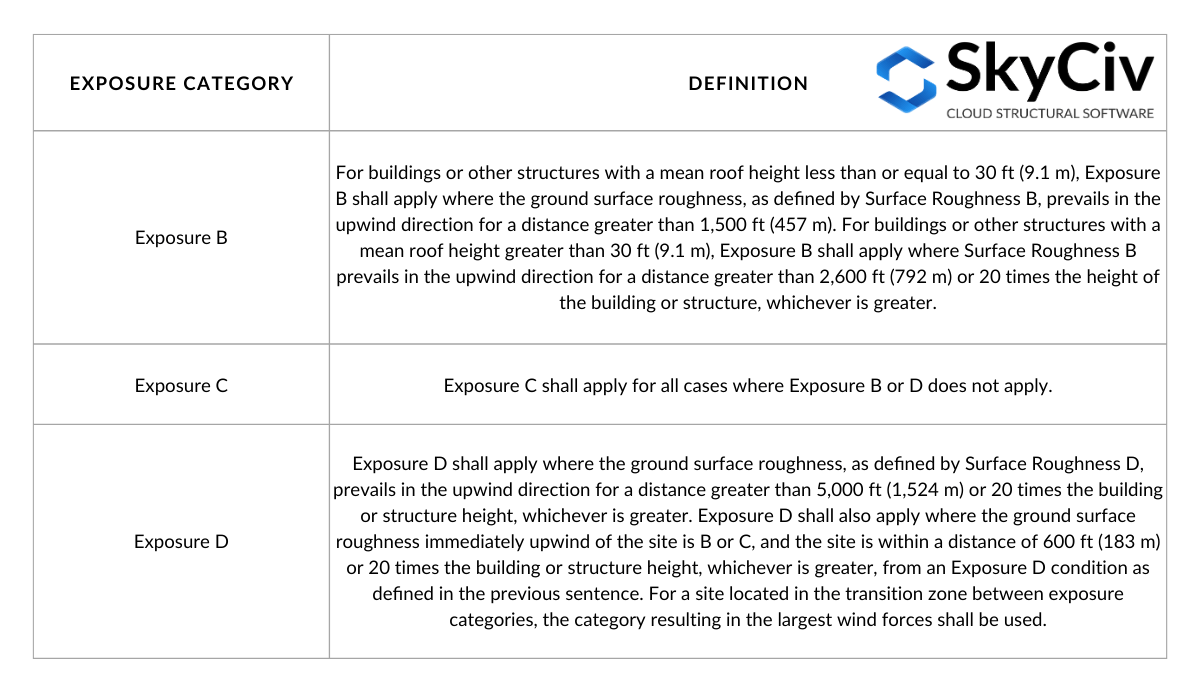
Table 2. Exposure Category definition based on Section 26.7.3 of ASCE 7-16.
The Table 2 can be visualized thru the following figures based on Figure C26.7-2:
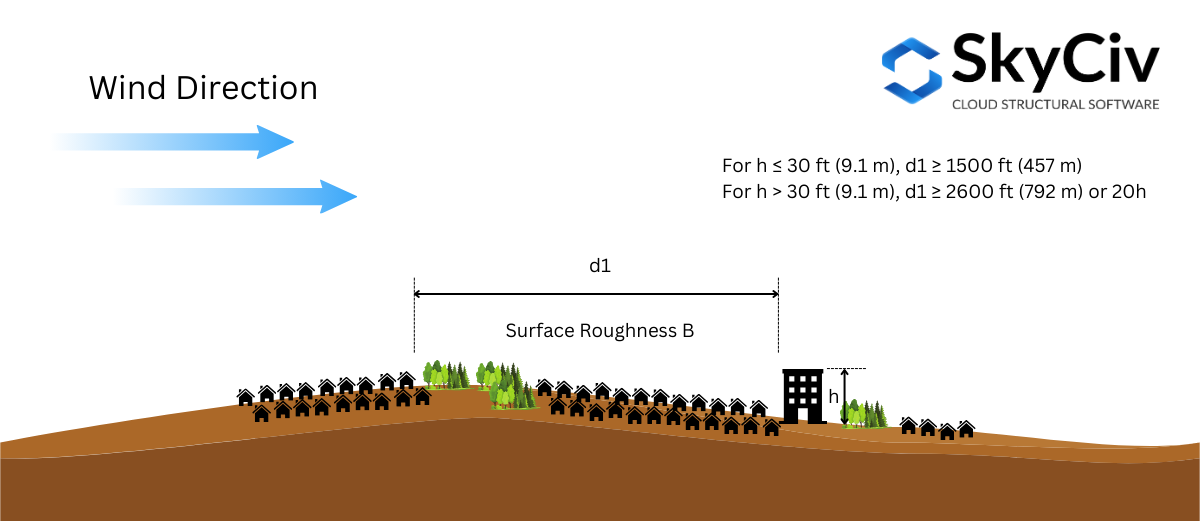
Figure 2. Upwind Surface Roughness conditions required For Exposure B.
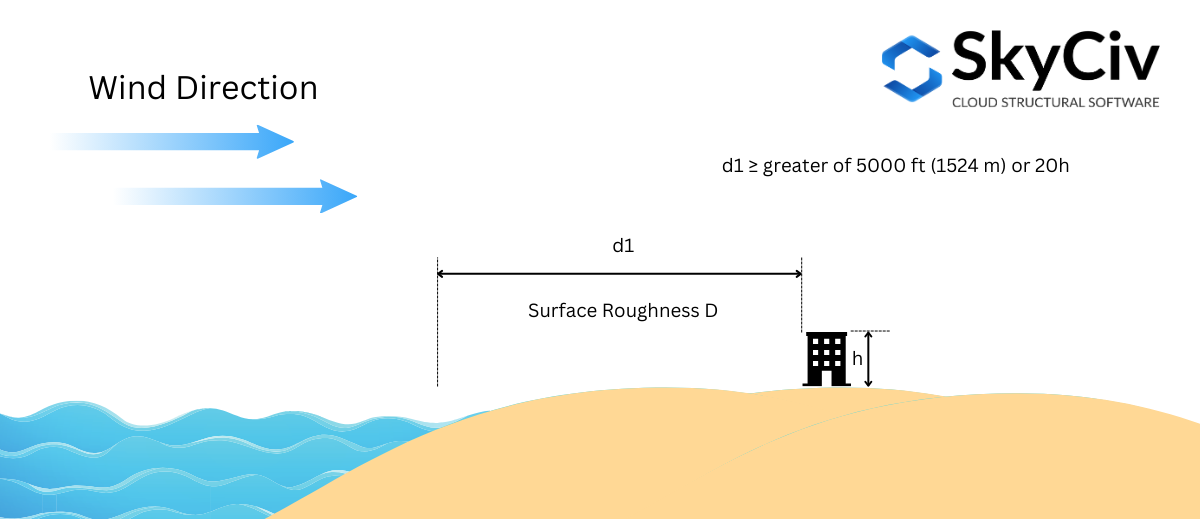
Figure 3. Upwind Surface Roughness condition required For Exposure D – case 1.
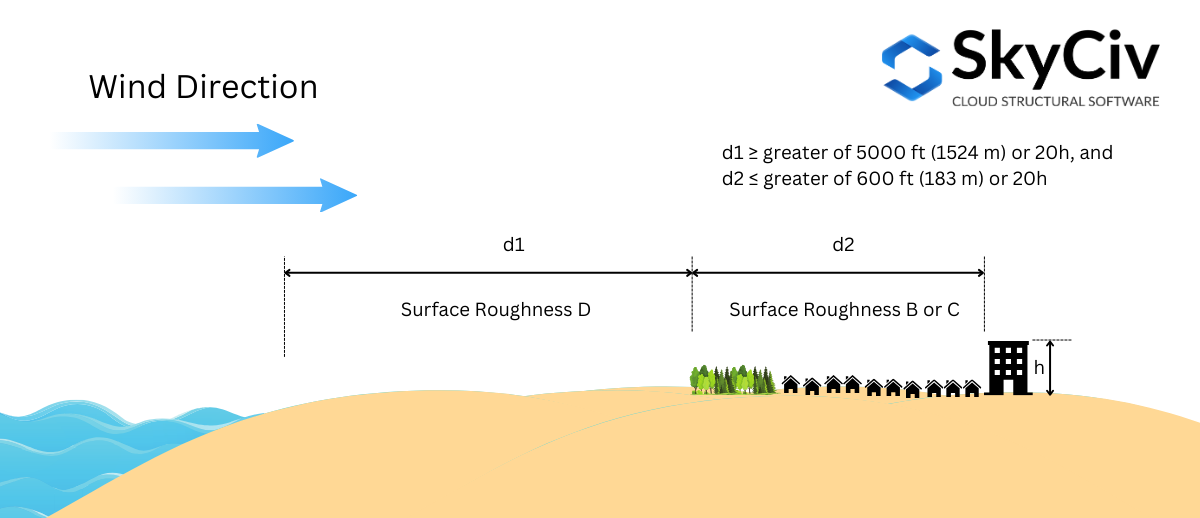
Figure 4. Upwind Surface Roughness condition required For Exposure D – case 2.
The Exposure Category shall be determined for each wind source direction. Using an example site location – “1200 S DuSable Lake Shore Dr, Chicago, IL 60605, USA”, lets analyze this for each direction.
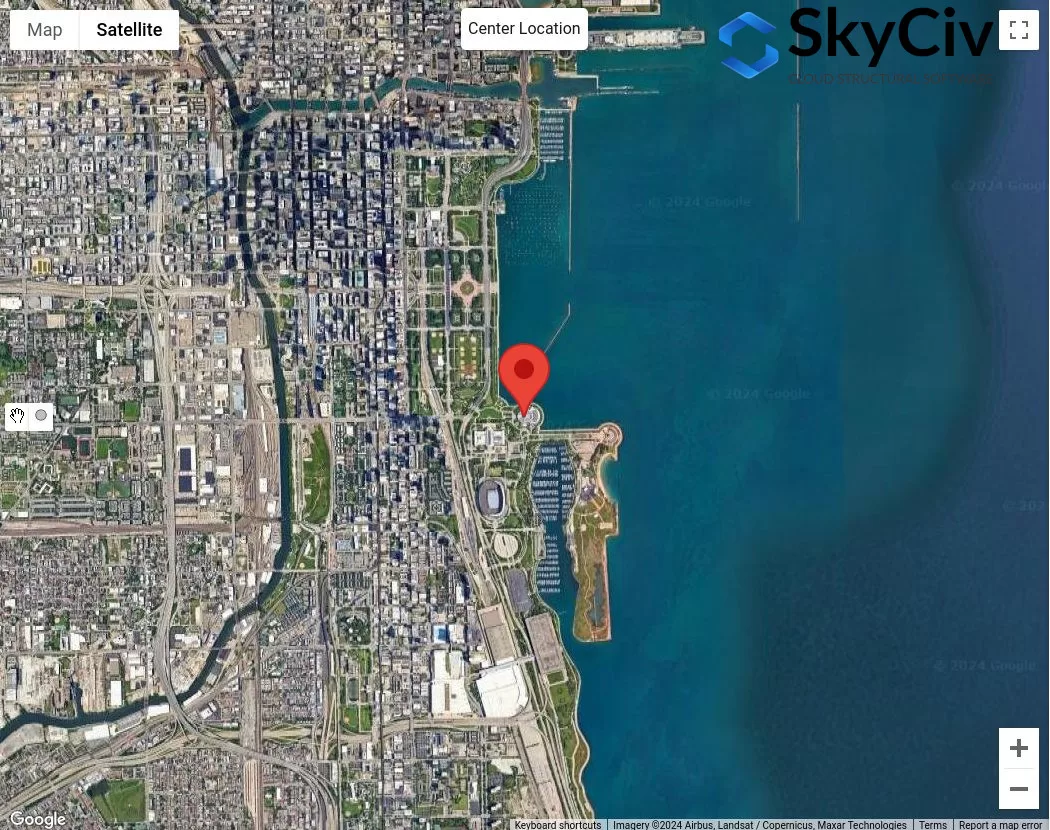
Figure 4. Sample location for Exposure Category analysis.
Assuming the mean roof height of the structure is 25 ft ( \( 20h = 500 ft \)), we will use the following procedure to check the Exposure Category for each sector:
Condition 1. Determine if Exposure D using Figure 3:
Using Figure 3 – where the distance \( d_{1} \) is 5000 ft (1524 m), we need to check for Exposure D, where Surface Roughness D is dominant for the whole 5000 ft stretch:
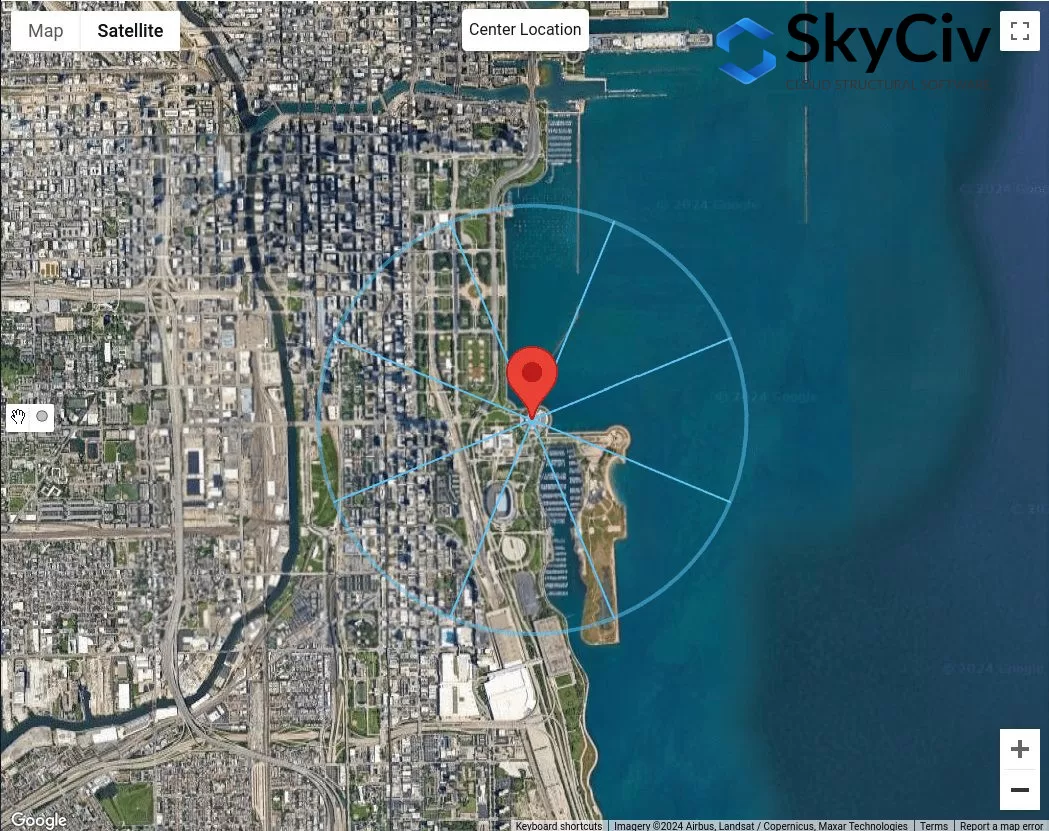
Figure 5. Offset distance of 5000 ft from site location for Exposure D check using Figure 3.
From Figure 5, we can already conclude that wind source directions N, NE, and E have Surface Roughness D for the whole 5000 ft stretch. Therefore, these wind source directions are Exposure D.
Condition 2. Determine if Exposure D using Figure 2
Using Figure 4 – where the distance \( d_{1} \) is 5000 ft (1524 m) and distance \( d_{2} \) is equal to 600 ft (183 m), we need to check for Exposure D. From Figure 5, this can only be applied for wind source direction from SE:
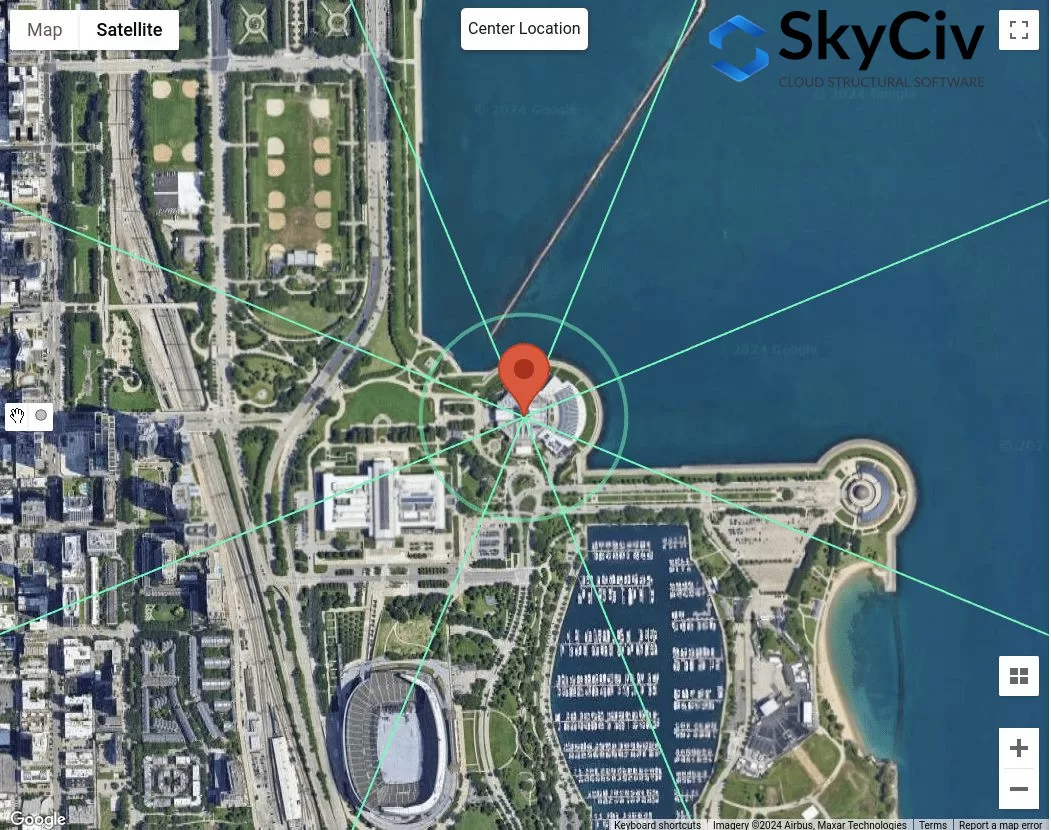
Figure 6. Offset distance of 600ft and additional 5000 ft from site location for Exposure D check using Figure 4.
For wind source direction SE, using \( d_{2} = 600 ft \), we can consider that this section is Surface Roughness B. However, for distance \( d_{1} = 5000 ft \), the section is not 100% Surface Roughness D. Hence, SE should not be considered as Exposure D.
Condition 3. Determine if Exposure B using Figure 1
Using Figure 3 – where the distance \( d_{1} \) is 1500 ft (457 m) since \( h < 30 ft \), we need to check for Exposure B.
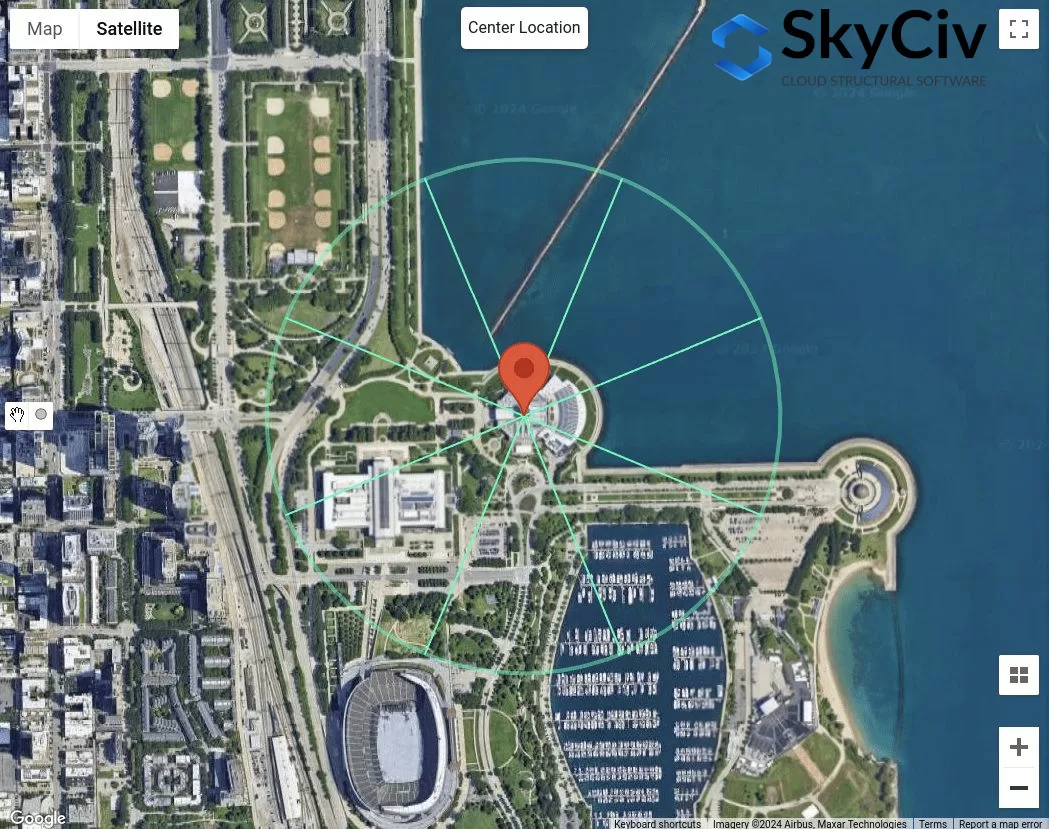
Figure 7. Offset distance of 1500 ft from site location for Exposure B check using Figure 3.
From Figure 7, we can determine that for wind source directions NW, W, SW, and S are classified as Exposure B as the surface roughness for each direction sector is Surface Roughness B.
Condition 4. If conditions 1 to 3 are not true, therefore, the terrain is Exposure C.
Therefore, for wind source direction SE, it is classified as Exposure Category C. In summary, the exposure categories for each wind source direction is shown in Figure 8 below.
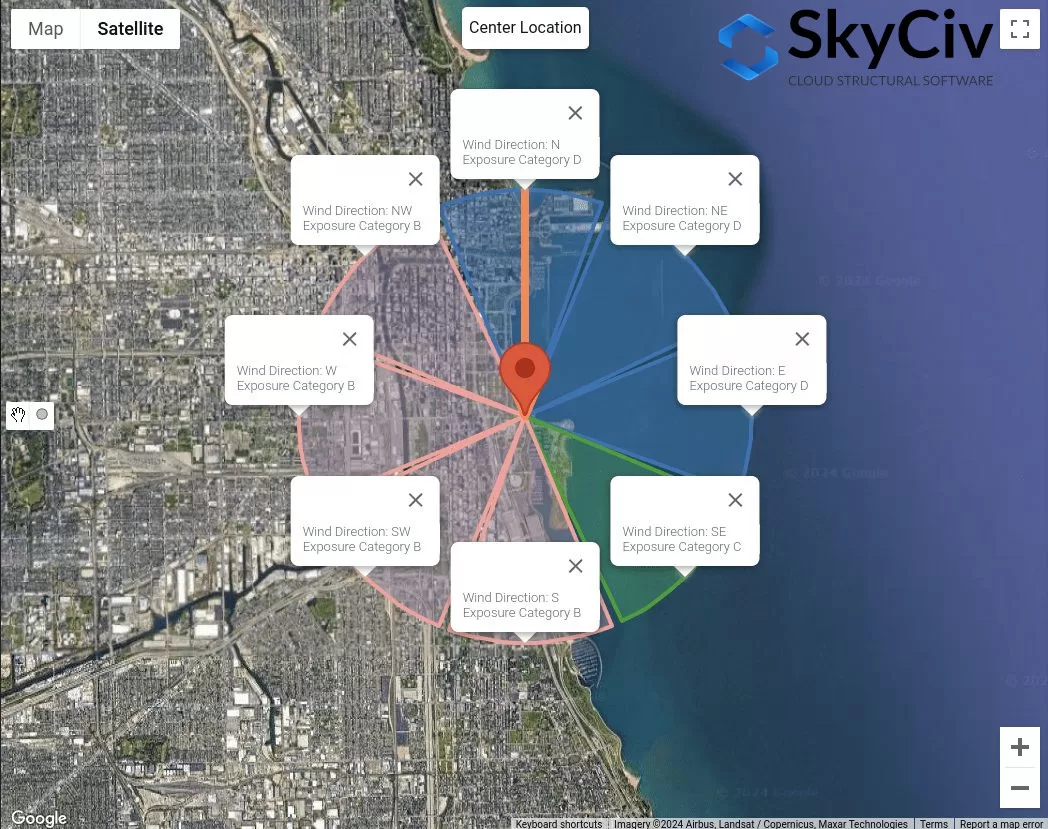
Figure 8. The exposure categories for each wind source direction.
These data can be used to determine what will be the worst wind source direction as the Velocity Pressure Coefficients \( K_{z} \), Topographic Factor \( K_{t} \), and Gust-effect Factor \( G \) using detailed calculation are affected by the Exposure Category.
NBCC 2015/2020
For NBCC 2015, the procedure to determine the Exposure Category of the upwind exposure of a site location is discussed in Section 4.1.7.3(5), depending on the terrain. For each wind source direction, it should be analyzed from two upwind sectors extending ±45°.
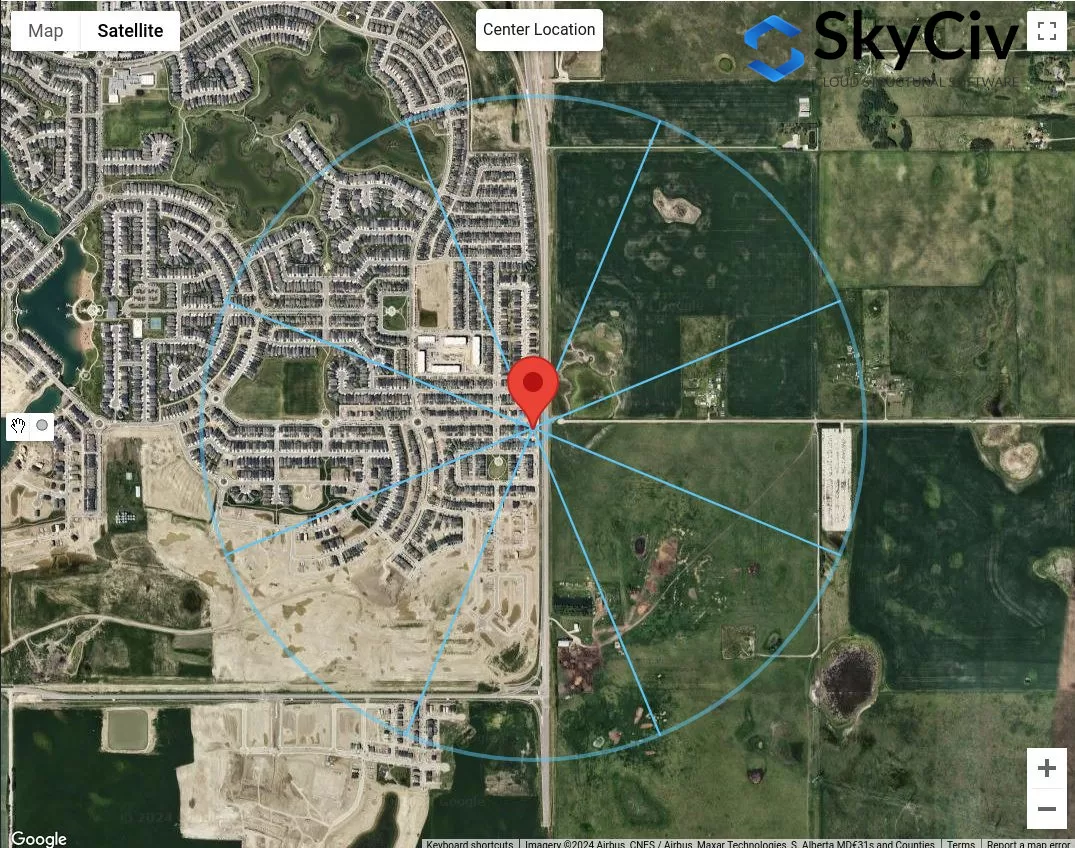
Figure 9. Terrain sectors for each wind source direction.
For each sector, the terrain category should be checked based on the following definition based on Section 4.1.7.3(5) of NBCC 2015:
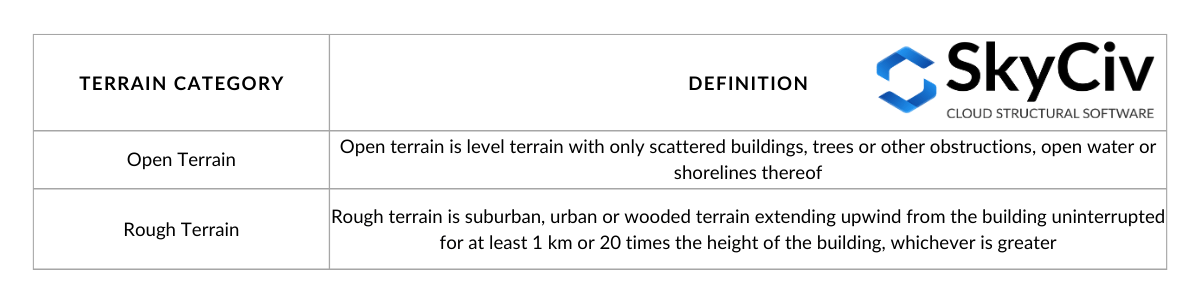
Table 3. Definition of terrain categories as defined in Section 4.1.7.3(5) of NBCC 2015.
Visualizing the options in Table 3:
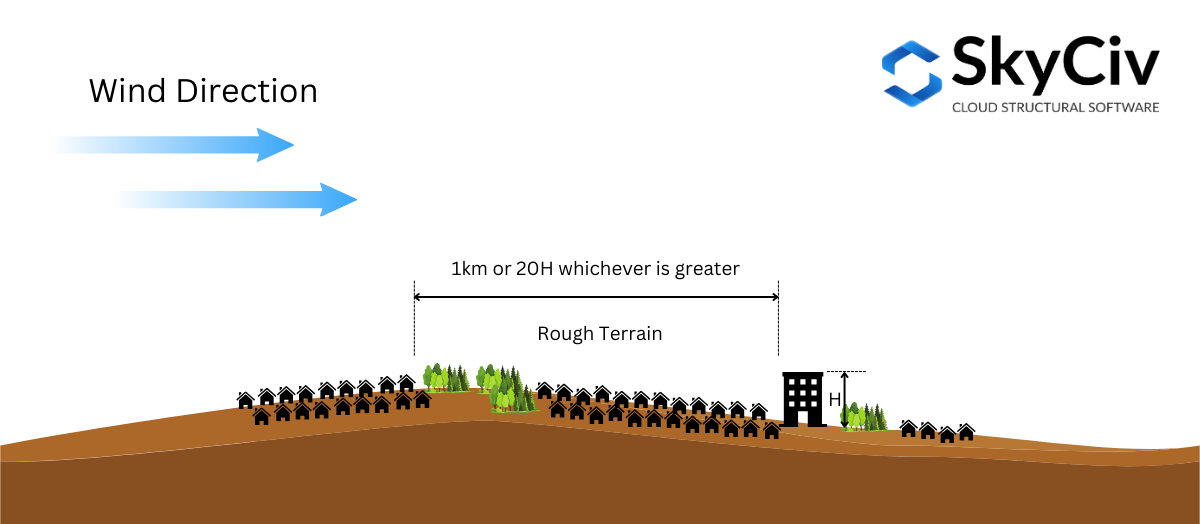
Figure 10. Definition of Rough Terrain as defined in Section 4.1.7.3(5) of NBCC 2015.
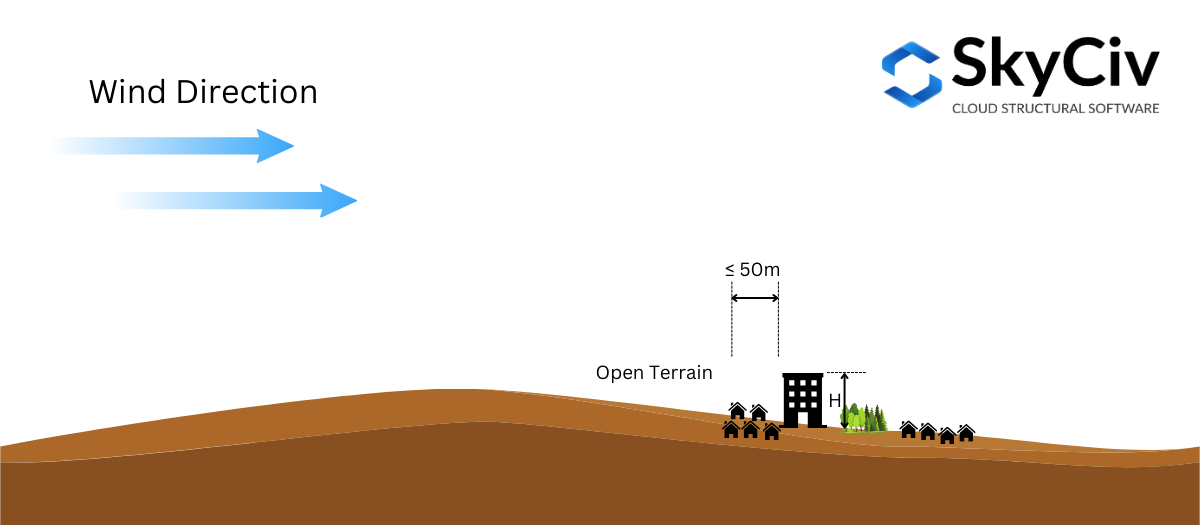
Figure 10. Definition of Open Terrain as defined in Section 4.1.7.3(5) of NBCC 2015.
Based on Section 4.1.7.3(5) of NBCC 2015, it is permitted to interpolate the Exposure Factor \( C_{e} \) in intermediate terrain. If the rough terrain distance from the structure location is greater than or equal to 1km or 20 times the structure height, whichever is greater, the terrain can considered as Rough Terrain, and if the distance is less than 50 m, it is considered as Open Terrain. Otherwise, the Exposure Factor \( C_{e} \) as per Section 4.1.7.3(5) will be calculated from the boundary values. This can be visualized in Figure 11 below.
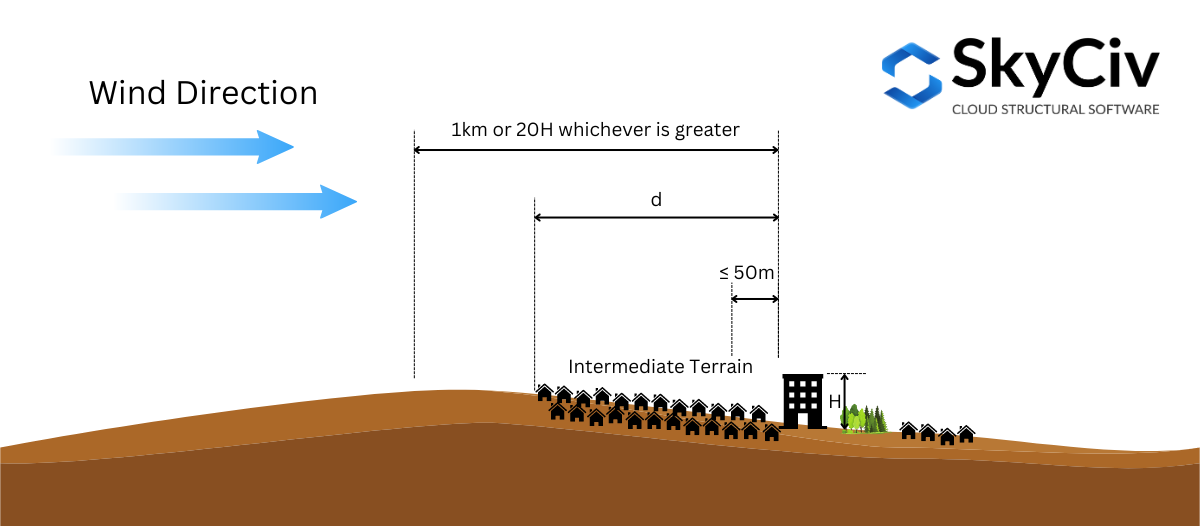
Figure 11. Definition of Intermediate Terrain as defined in Section 4.1.7.3(5) of NBCC 2015.
To further illustrate this, let’s use an example site location – “657 Masters Rd SE, Calgary, AB T3M 2B6, Canada,” assuming the structure height \( H \) is 25 m ( \( 20H = 500 m \)).
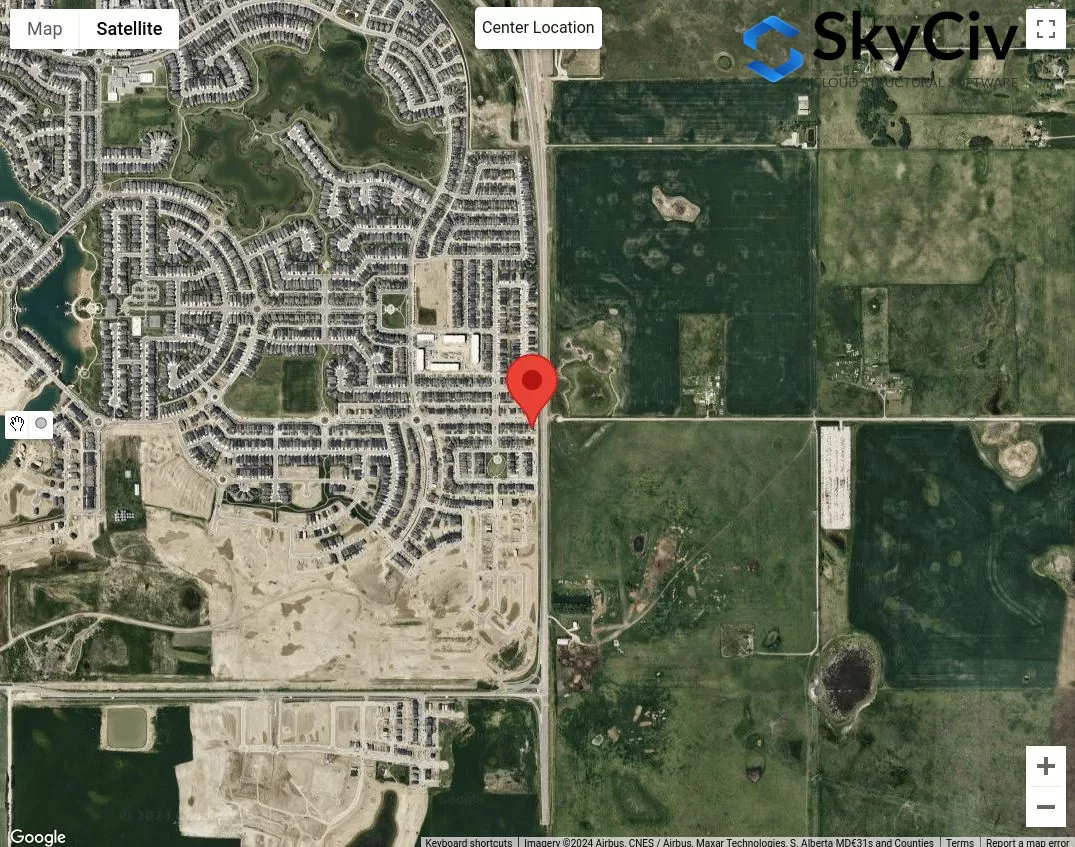
Figure 12. Sample location for Terrain Category analysis.
First step is to classify the obvious rough and open terrain categories for each wind source direction. We can draw 50m and max of 1 km or \( 20 H \) radius from the site location.
Figure 13. Offset distance of 50m and 1km for determining terrain category based on Table 1 definitions.
From Figure 13, we can say that the wind source directions NE, E, and SE are classified as Open terrain as the rough terrain length for each direction is less than 50m from the site location. Moreover, for wind source directions W and NW can be classified as Rough Terrain as the rough terrain length for these directions is greater than 1 km. For wind source direction N, we can conservatively assume that the Open Terrain is dominant in this direction. For the rest, S and SW, we can conclude that these are Intermediate Terrain and we will need to measure the distance of the rough terrain from the site location.
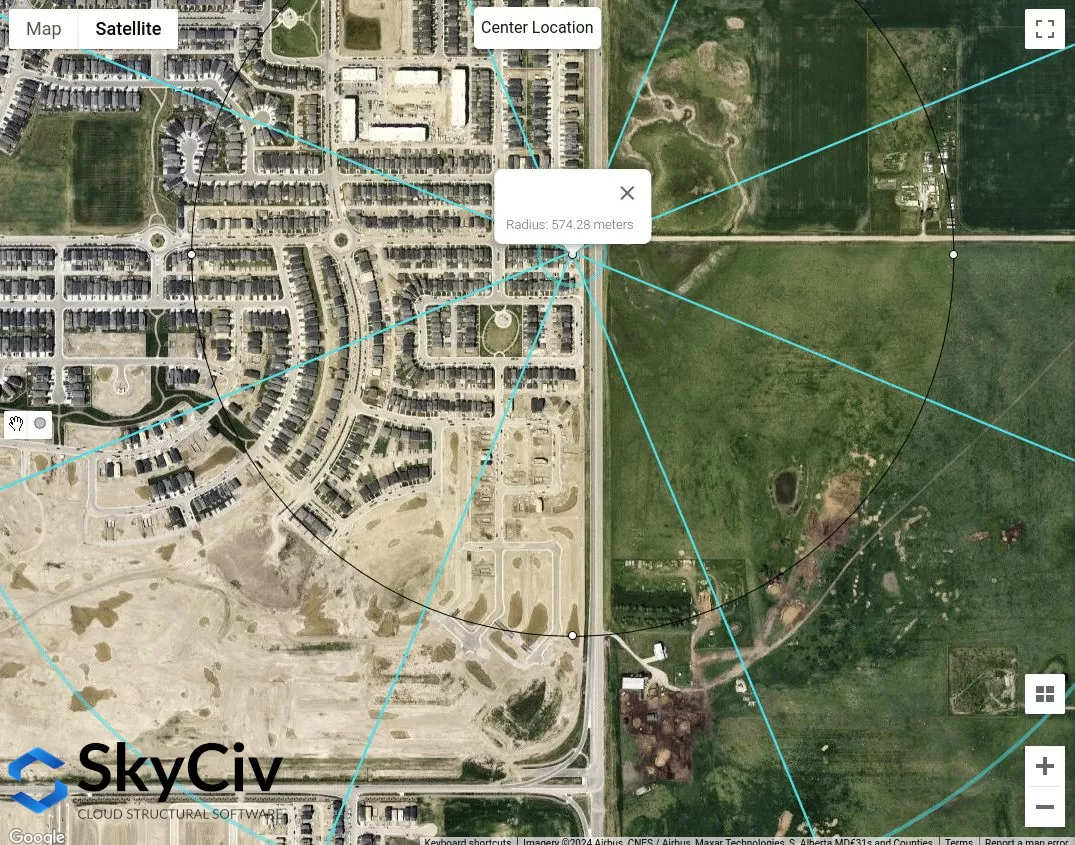
Figure 14. Approximate rough terrain length measured from site location for SW wind source direction equal to 574 m.
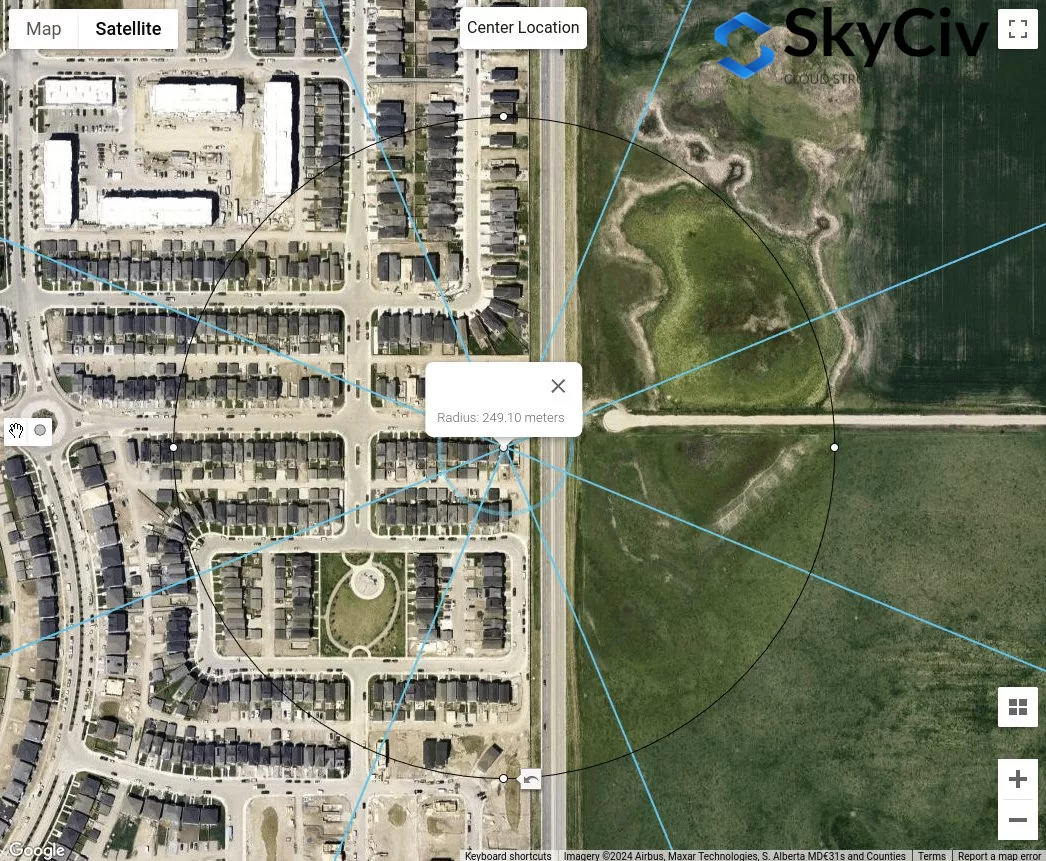
Figure 15. Approximate rough terrain length measured from site location for S wind source direction equal to 249 m.
From the analysis above, definitely the wind source directions with Open Terrain will definitely yield the conservative values. However, if all wind source directions are classified to Intermediate Terrain, the procedure above is how you can determine the appropriate Terrain Category for each direction.
AS/NZS 1170.2 (2021)
For AS/NZS 1170.2, the same procedure with the above references applies in determining the Terrain Category of the upwind exposure of a site location. This is discussed in Section 4.2 of AS/NZS 1170.2 (2021). For each wind source direction, it should be analyzed from two upwind sectors extending ±45°. The definition of each terrain category are shown below based on Section 4.2.1 of AS/NZS 1170.2 (2021):
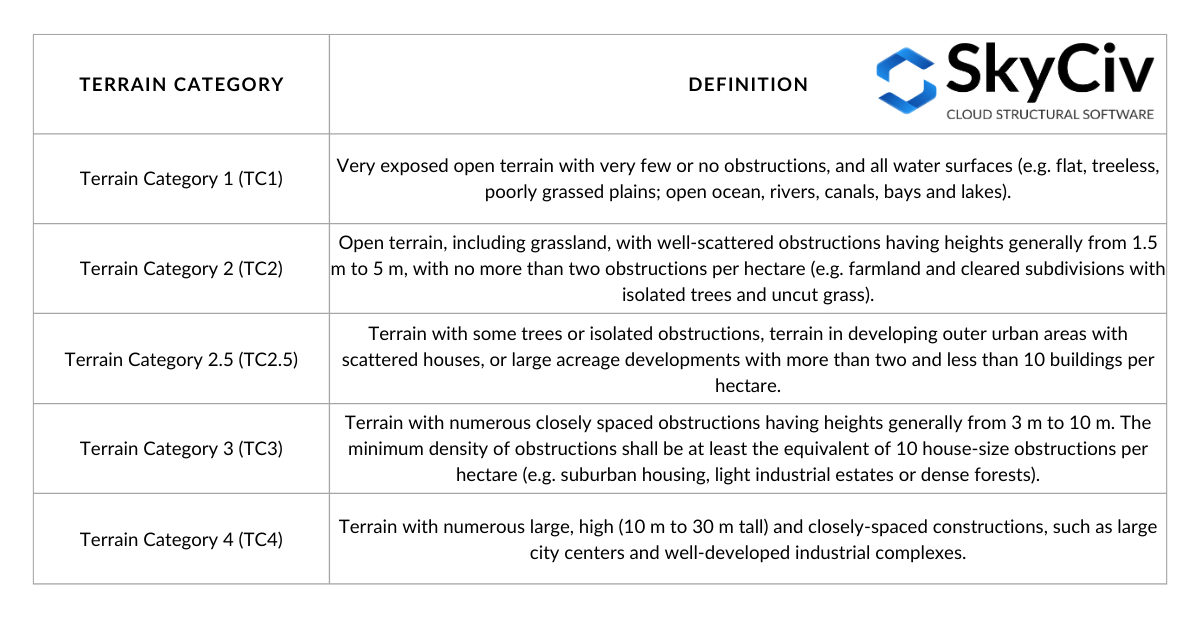
Table 4. Definition of terrain categories as defined in Section 4.2.1 of AS/NZS 1170.2 (2021).
In determining the terrain category for a direction, a lag distance equal to \( 20 z \) from the structure location shall be neglected. From this point, an offset distance (averaging distance) of 500 m or \( 40 z\), whichever is larger, shall be used as shown in Figure 16 below. The \( z \) value is equal to the average roof height, \( h \), when it is less than or equal to 25 m. It is possible that within this averaging distance to have multiple terrain categories, and as such, linear interpolation of shall be used in determining the \( M_{z,cat} \) values, depending on the length of each terrain category, as illustrated in Figure 4.1 of AS/NZS 1170.2 (2021). In this article, we shall only consider a homogeneous terrain category within the averaging distance.
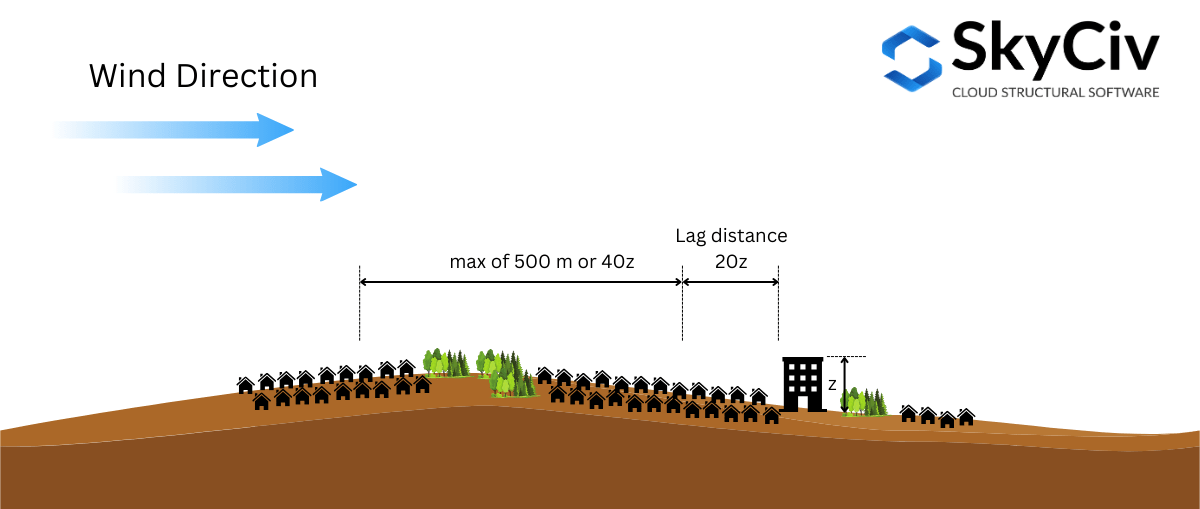
Figure 16. Illustration of the distances used in determing Terrain Category based on AS/NZS 1170.2 (2021).
To further illustrate this, let’s use an example site location – Lat: 32°43’46″S Lng: 151°31’47″E – assuming the mean roof height \( h \) is 10 m ( where \( 20z = 20h = 200 m \) and \( 40z = 400 m \)).
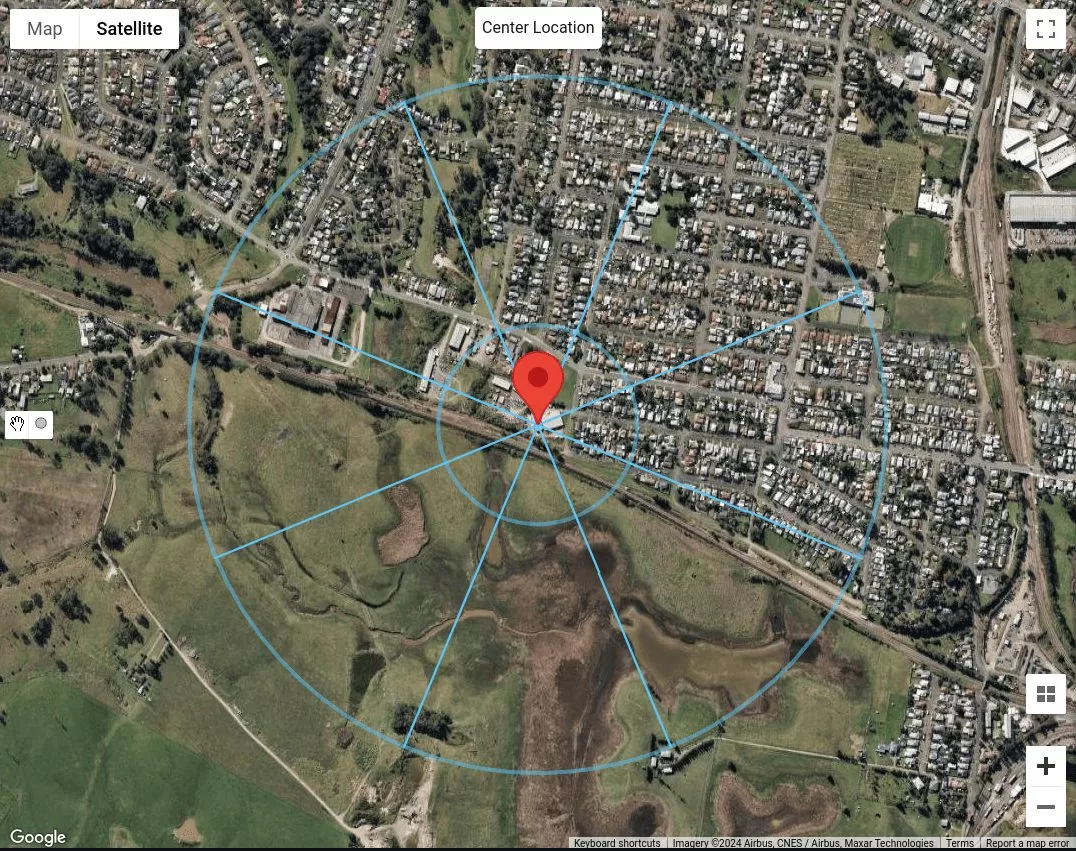
Figure 17. The site location with lag distance equal to 200 m and averaging distance equal to 500 m for each wind source direction.
Since we are only to consider the terrain category as homogeneous throughout the entire 500m or \( 40z \) distance, we can already classify each wind source direction. Assuming the buildings on N, NE and E, are buildings that are 5 to 10 m tall, we can classify these to Terrain Category 3 (TC3) as shown in Table 4. For wind source directions SE, S, SW, and W, since these are grass plains without obstructions, we can classify these as Terrain Category 1 (TC1). Finally, for wind source direction NW, we can deduce that there are more than two but less than 10 buildings per hectare, with scattered houses. Therefore, we can classify this as Terrain Category 2.5 (TC2.5).
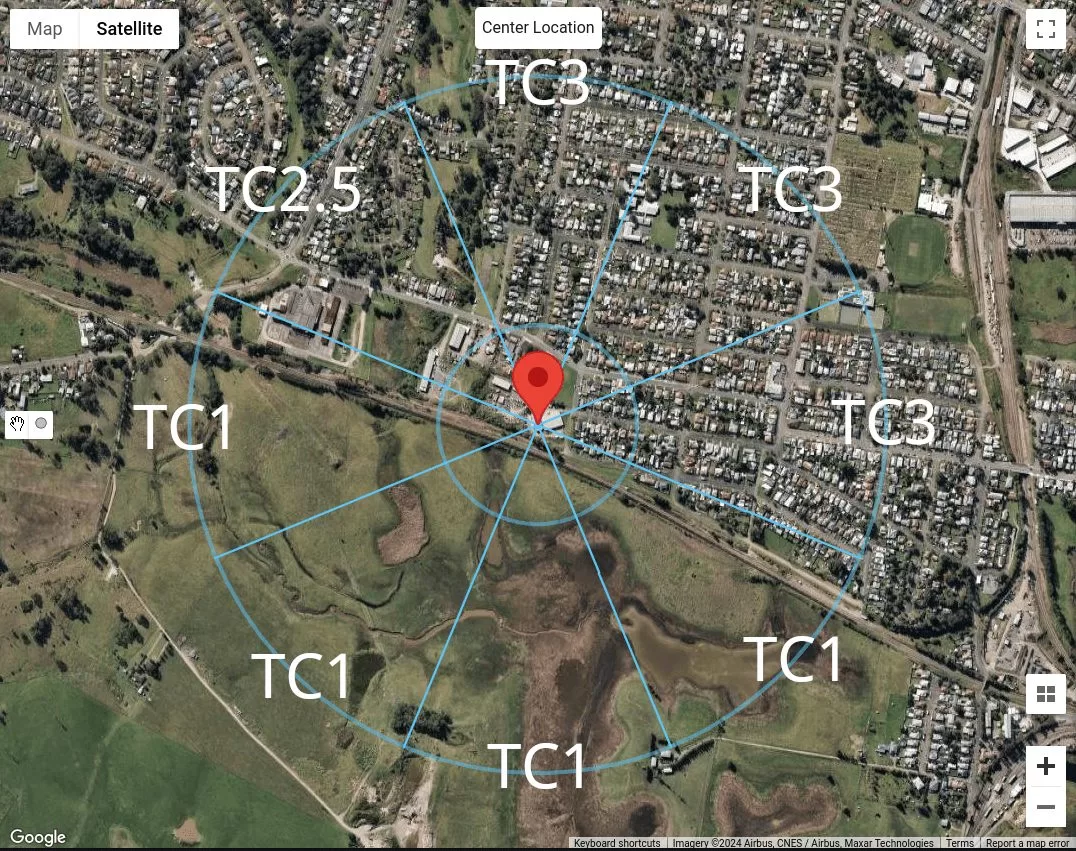
Figure 18. Summary of terrain category classification for each wind source direction for our sample location.
Using SkyCiv Load Generator
In SkyCiv Load Generator version v4.7.0, new map tools are introduced – Measure Distance and Distance Radii tools.
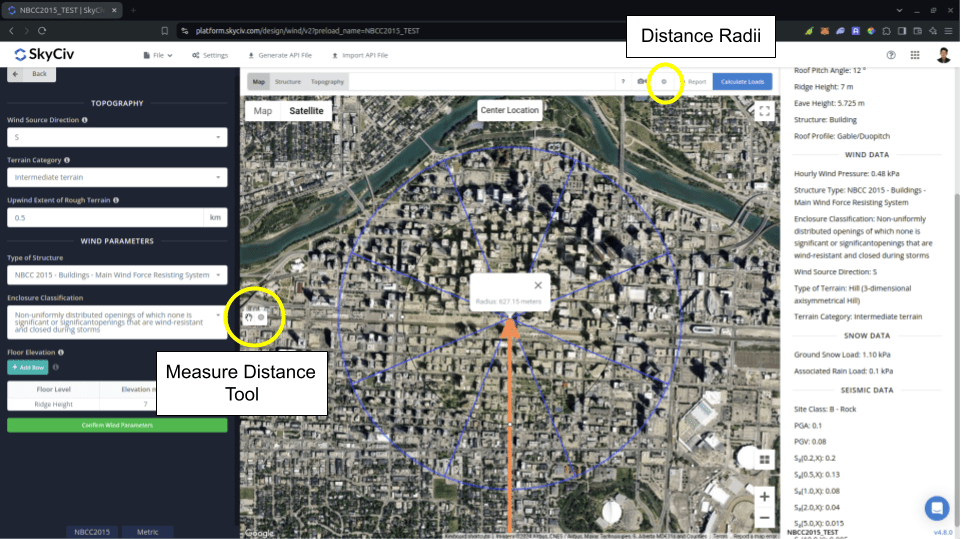
Figure 19. Distance measuring tools introduced to SkyCiv Load Generator.
The Measure Distance tool is used for generating a circle from a clicked point in the map and show its radius in meters. This way, you can measure the distances from the location being analyzed the certain locations. This can be used in measuring in NBCC 2015 for the Upwind Extent of Rough Terrain used in calculating Exposure Factor \( C_{e} \). Clicking the circle generated will clear it from the map.
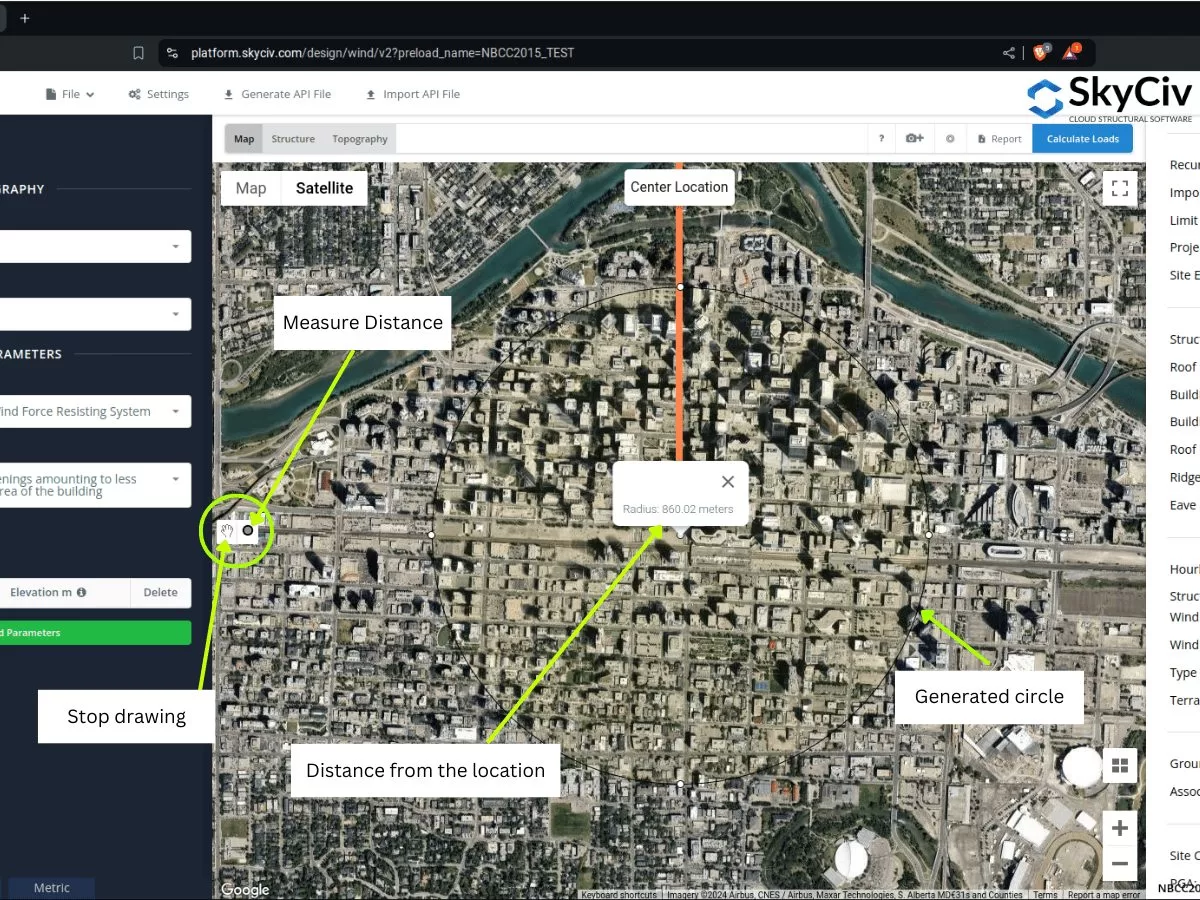
Figure 20. Measure distance tool which creates an offset from the location and showing the radius/offset distance from the center introduced to SkyCiv Load Generator.
On the other hand, the Distance Radii is introduced so users can draw circles with specified distances from location for each wind source category. It is a toggle button to show or hide the distance radii on the map, with the site location as the center of the circles.
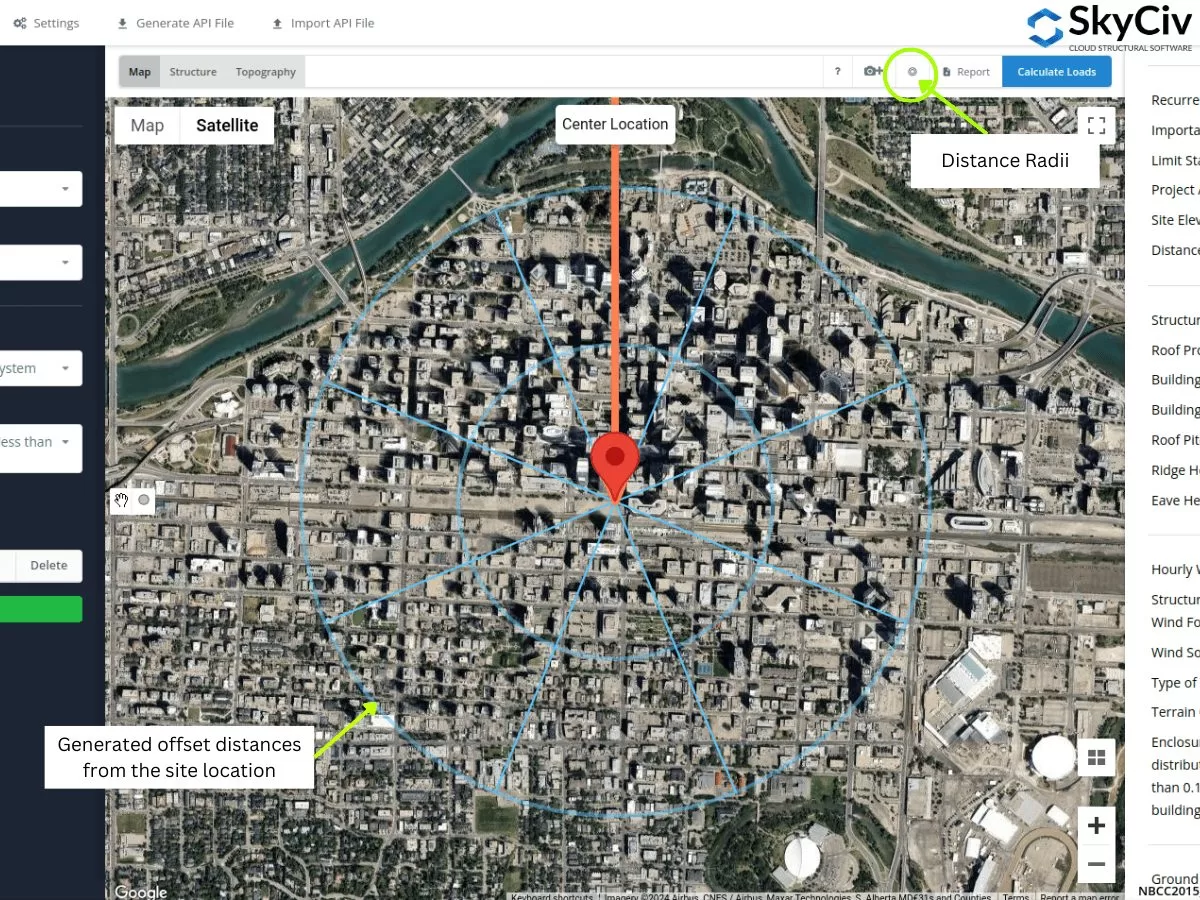
Figure 21. Distance Radii tool which specified offset distances from the site location introduced to SkyCiv Load Generator.
The radii values can be edited upon opening the Settings.
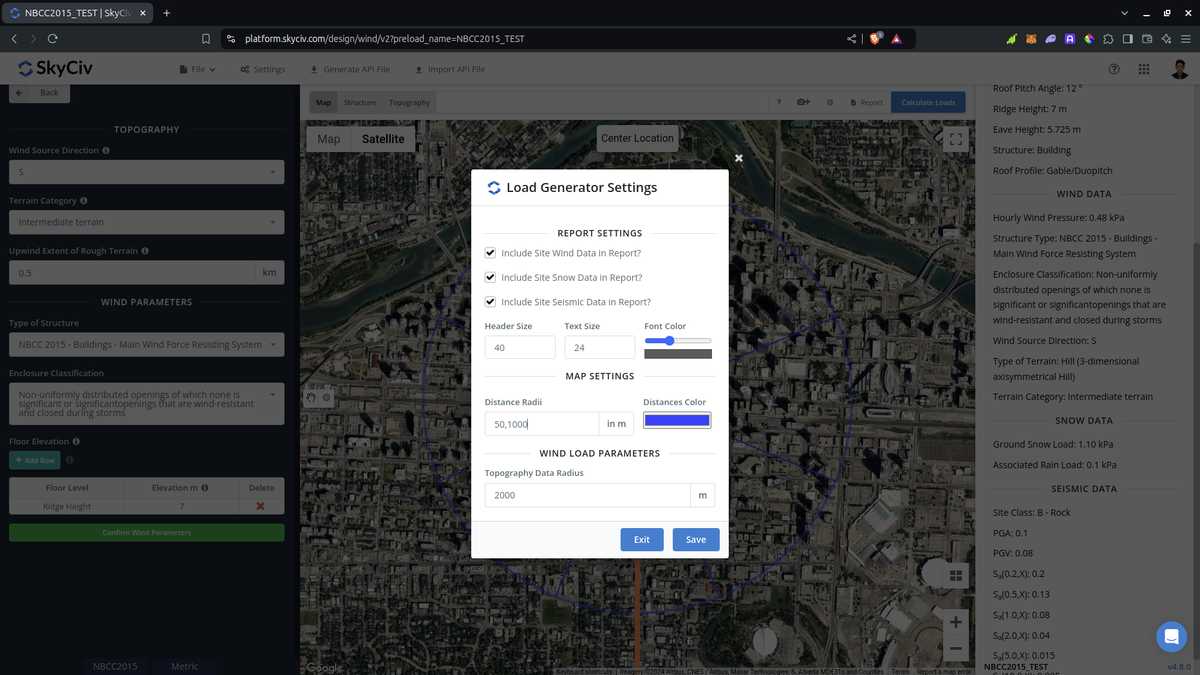
Figure 22. Option in settings to edit the distances for the Distance Radii tool in SkyCiv Load Generator.
Take note that users must edit the distance values as these are not automatically calculated by the software. Using this for ASCE 7 and NBCC, the worst exposure or terrain category for each wind source direction shall be adopted. With regard to using it in AS/NZS 1170.2 (2021), the software doesn’t use the radii values to calculate for the average \( M_{z,cat} \) values. Instead, the averaging distance is used as the applicable range where we can assign a homogeneous Terrain Category, adopting the worst category for each wind source direction.
From the sections discussed above, you can use these new tools to determine the exposure or terrain categories for each wind source directions. The procedures above can give you a quick terrain classification of each wind source direction. Using GIS and AI tools, you can further check the criteria that we used above for each wind source direction and can get a better and efficient result.

Structural Engineer, Product Development
MS Civil Engineering
References:
- Minimum Design Loads for Buildings and Other Structures. (2017). ASCE/SEI 7-16. American Society of Civil Engineers.
- National Research Council of Canada. (2015). National Building Code of Canada, 2015. National Research Council of Canada.
- Standards Australia (2021), Structural Design Actions. Part 2 Wind Actions, Australian/New Zealand Standard AS/NZS1170.2:2021, Standards Australia, Sydney, NSW, Australia.
- Google Maps