記事上で, サイトの場所の風上側の地形または露出カテゴリーを決定する方法を説明します。, 風荷重の計算に不可欠なもの. ASCE で概説されている具体的な手順について説明します。 7, NBCC 2015, およびAS/NZS 1170.2 地形カテゴリを決定し、それらが SkyCiv Load Generator で利用可能な各参照コードにどのように適用されるかについて説明します。.
ASCE 7-16/ASCE 7-22
地形係数を計算することにより、構造物の風荷重に対する地形の影響について説明します。 7, サイトの場所の風上暴露の暴露カテゴリーを決定する手順については、セクションで説明します。 26.7, 地形に応じて. 記事上で, リファレンスを簡略化するため, ASCEを使用します 7-16. 風源方向ごとに, ±45°の範囲にある 2 つの風上セクターから分析する必要があります。.
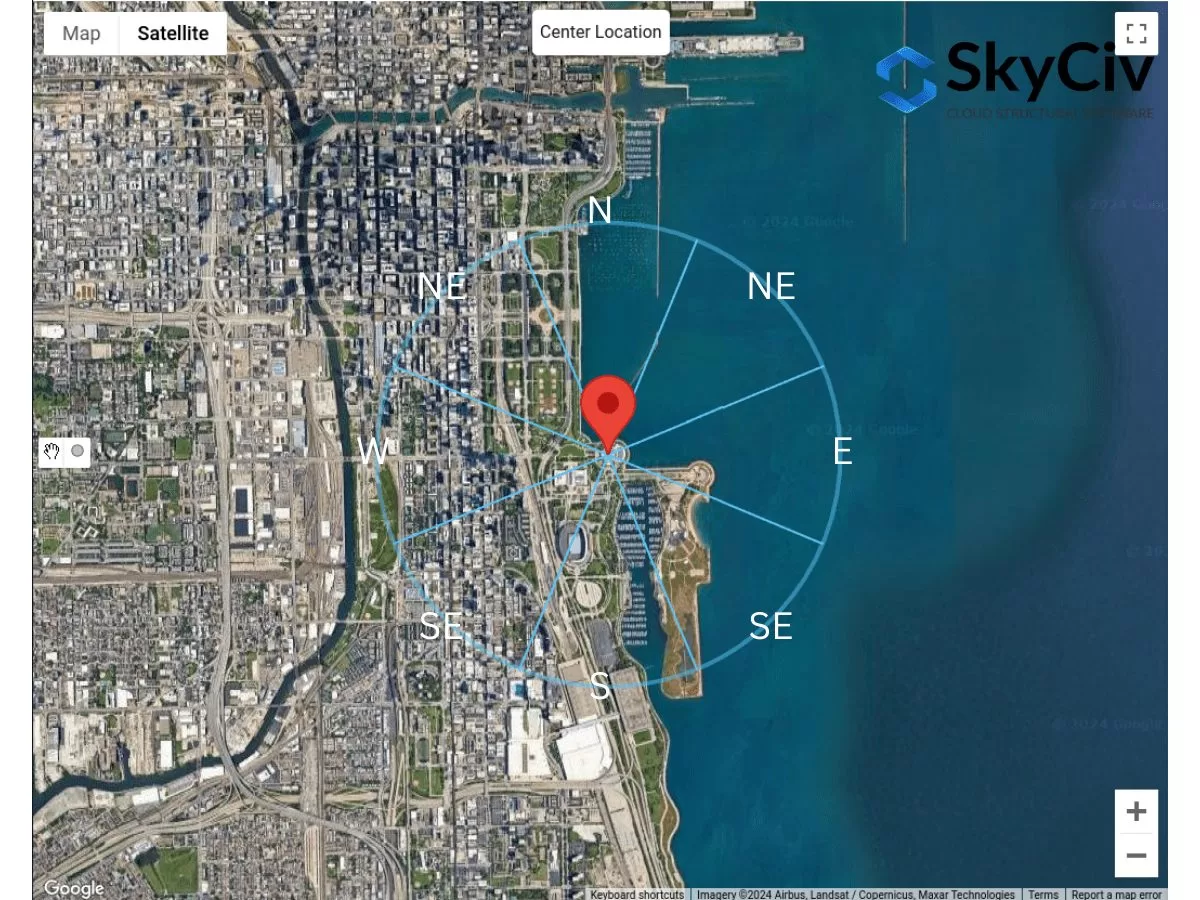
図 1. 各風源方向の地形セクター.
分野ごとに, 表面粗さカテゴリは、セクションに基づく次の定義に基づいてチェックする必要があります。 26.7.2 ASCEの 7-16:
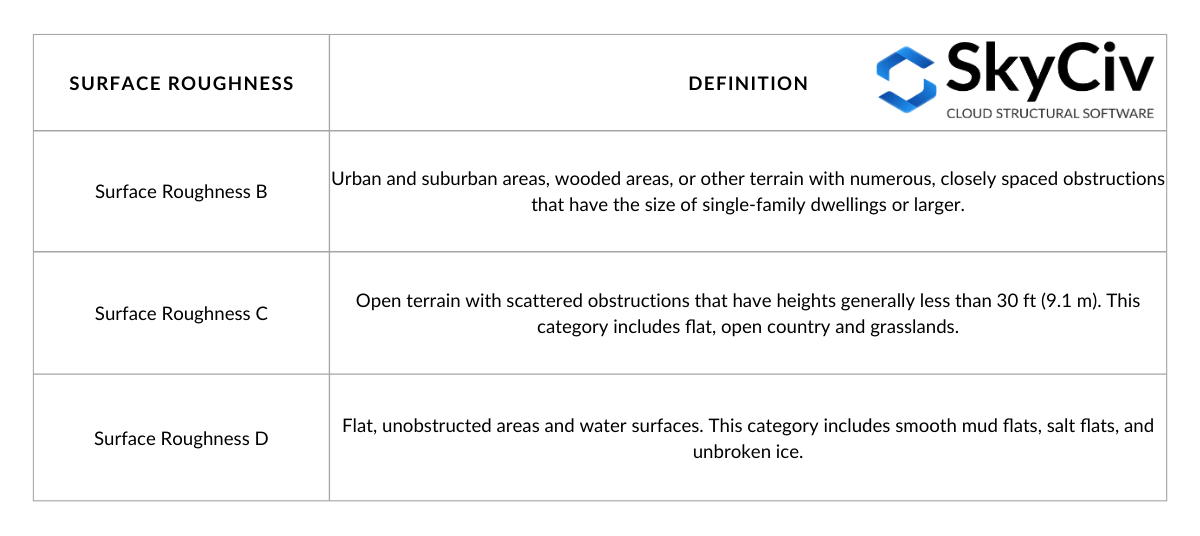
テーブル 1. 断面に基づく表面粗さの定義 26.7.2 ASCEの 7-16.
表面粗さの定義より, 風上セクターによって境界付けられた地形の露出カテゴリーを決定できます。. 各暴露カテゴリーの定義はセクションに記載されています。 26.7.3 ASCEの 7-16 次のように:
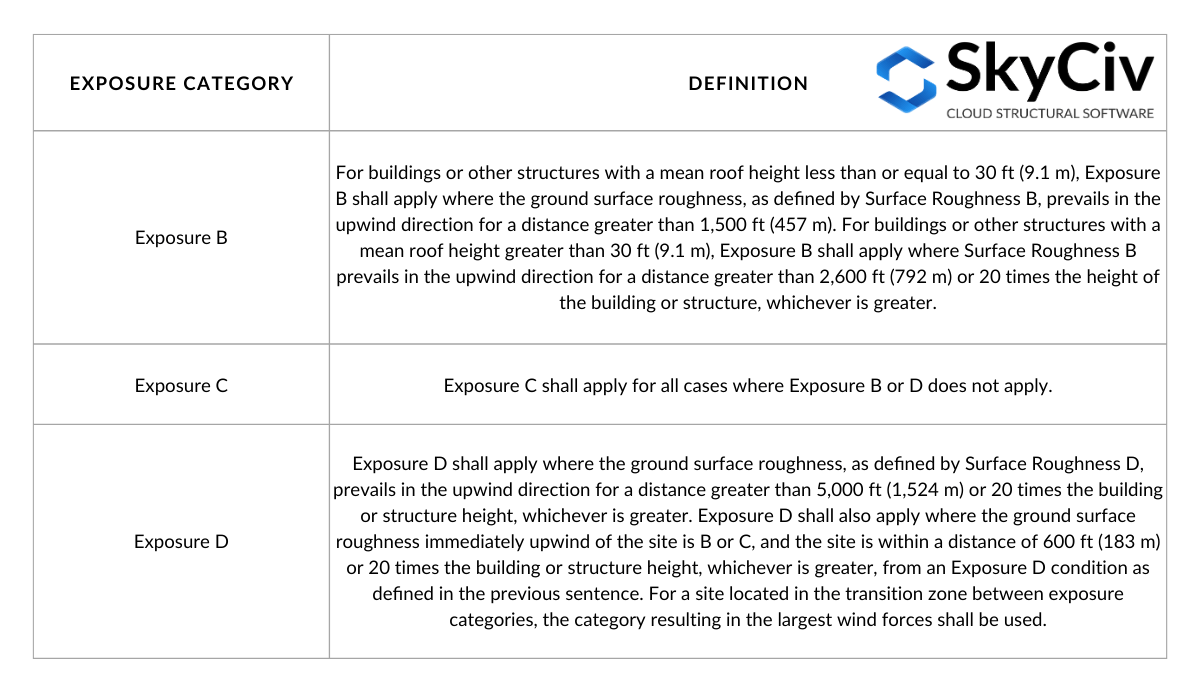
テーブル 2. セクションに基づく暴露カテゴリーの定義 26.7.3 ASCEの 7-16.
テーブル 2 図 C26.7-2 に基づいて次の図で視覚化できます。:
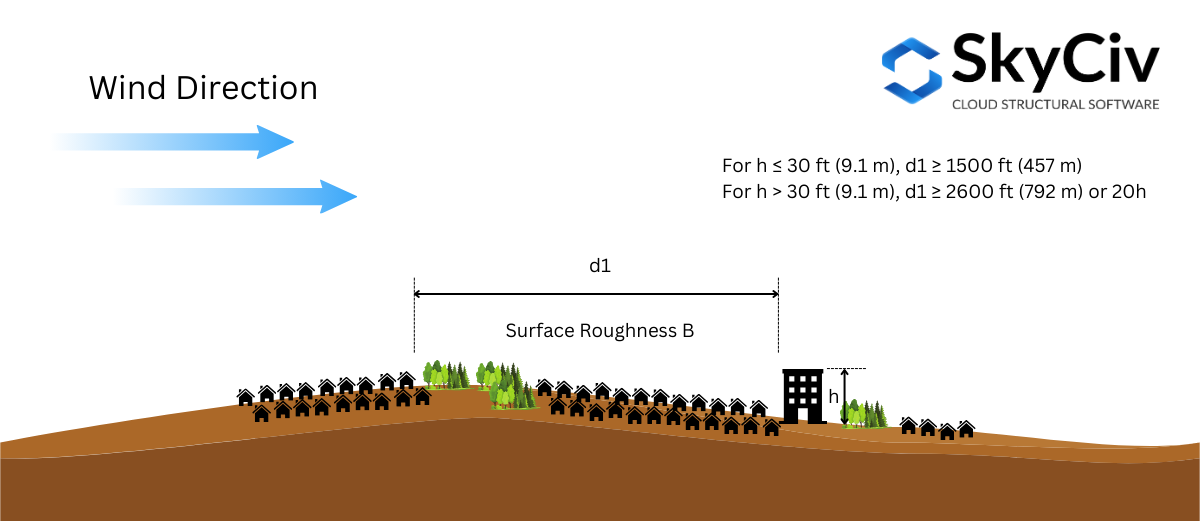
図 2. 露出 B に必要な風上表面粗さ条件.
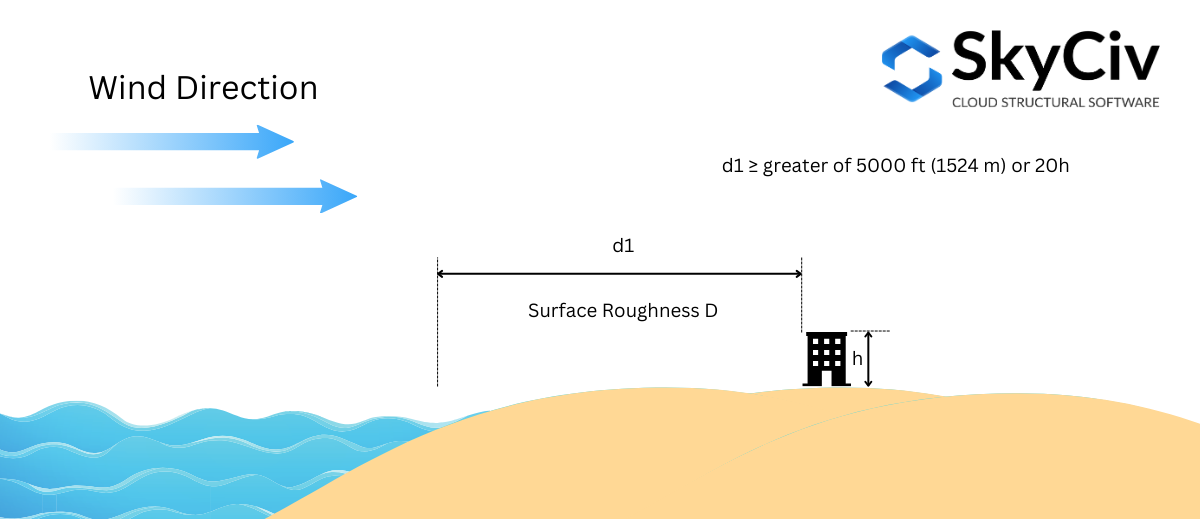
図 3. 風上表面粗さ条件は露出 D に必要です – 場合 1.
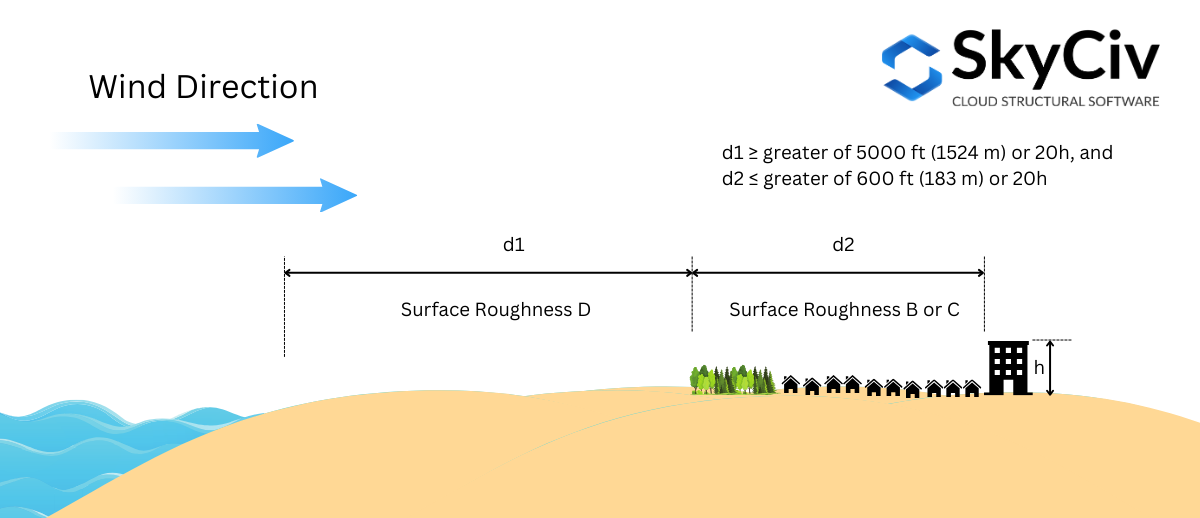
図 4. 風上表面粗さ条件は露出 D に必要です – 場合 2.
暴露カテゴリーは風源方向ごとに決定されます。. サイトの場所の例を使用する – “1200 S デュセーブル レイク ショア ドライブ, シカゴ, THE 60605, 米国”, これを方向ごとに分析してみましょう.
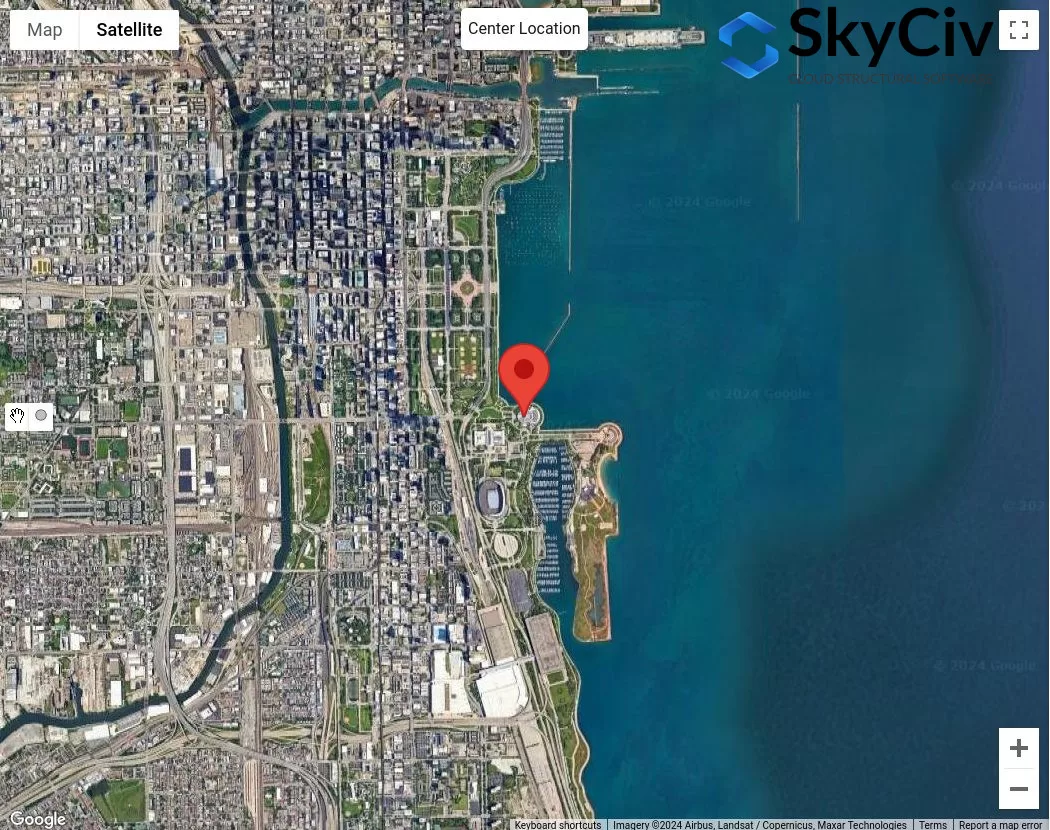
図 4. 暴露カテゴリ分析のサンプルの場所.
構造物の屋根の平均高さを次のように仮定すると、 25 フィート ( \( 20h = 500 フィート \)), 次の手順を使用して、各セクターの露出カテゴリーを確認します。:
状態 1. 図を使用して露出 D かどうかを判断します。 3:
図の使用 3 – 距離はどこにあるのか \( d_{1} \) です 5000 フィート (1524 メートル), 露出 D を確認する必要があります, 表面粗さ D が全体的に支配的な場合 5000 フィートストレッチ:
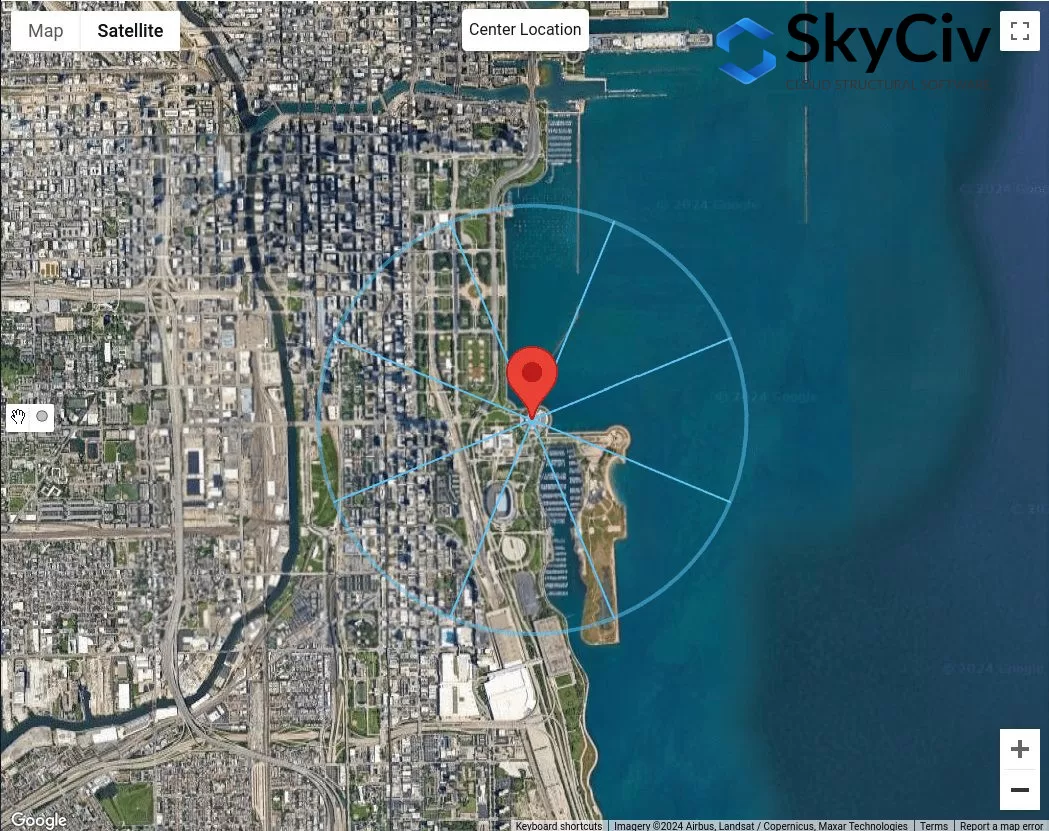
図 5. オフセット距離 5000 図を使用した暴露 D チェックの現場位置からのフィート 3.
図から 5, 風力源の方向は次のとおりであるとすでに結論付けることができます。 N, 生まれ, およびE 全体の表面粗さはDです 5000 フィートストレッチ. したがって, これらの風源の方向は 露出D.
状態 2. 図を使用して露出 D かどうかを判断します。 2
図の使用 4 – 距離はどこにあるのか \( d_{1} \) です 5000 フィート (1524 メートル) そして距離 \( d_{2} \) に等しい 600 フィート (183 メートル), 露出 D を確認する必要があります. 図から 5, これは南東からの風源方向にのみ適用できます。:
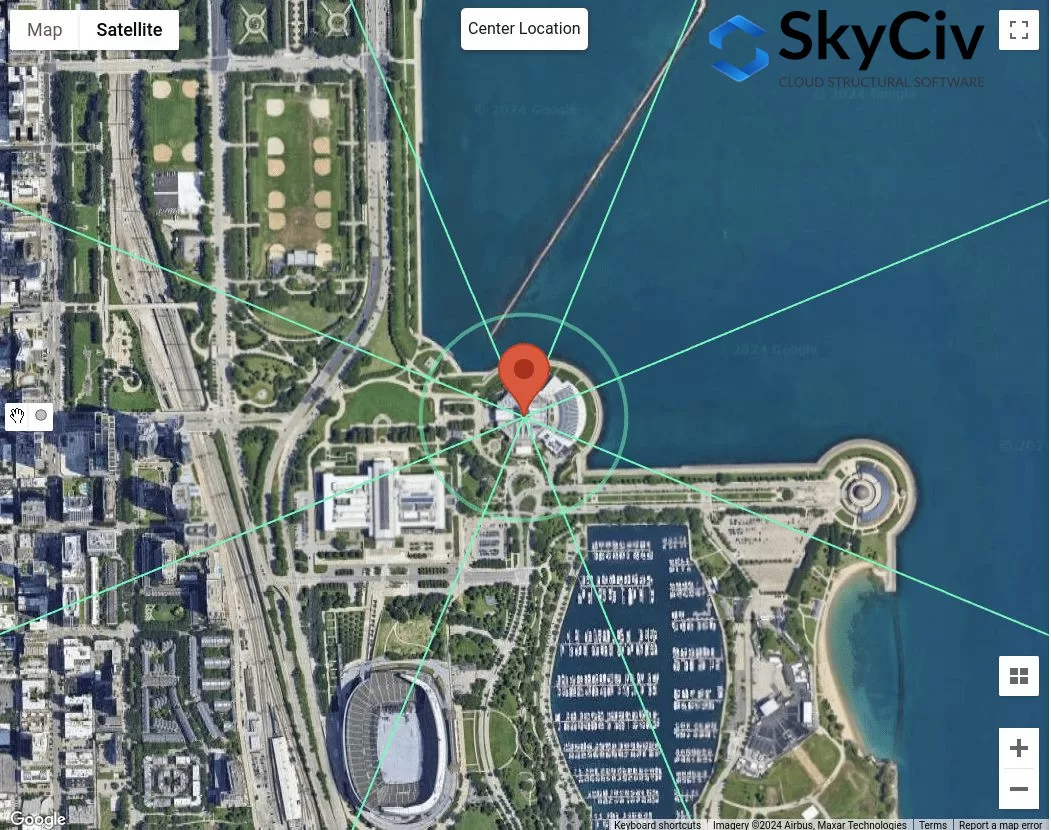
図 6. オフセット距離600フィート以上 5000 図を使用した暴露 D チェックの現場位置からのフィート 4.
風源方向SE用, を使用して \( d_{2} = 600 フィート \), このセクションは表面粗さ B であると考えることができます。. しかしながら, 距離のために \( d_{1} = 5000 フィート \), セクションはそうではありません 100% 表面粗さD. したがって, SE は露出 D として考慮されるべきではありません.
状態 3. 図を使用して露出 B かどうかを判断します。 1
図の使用 3 – 距離はどこにあるのか \( d_{1} \) です 1500 フィート (457 メートル) 以来 \( h < 30 フィート \), 露出 B をチェックする必要があります.
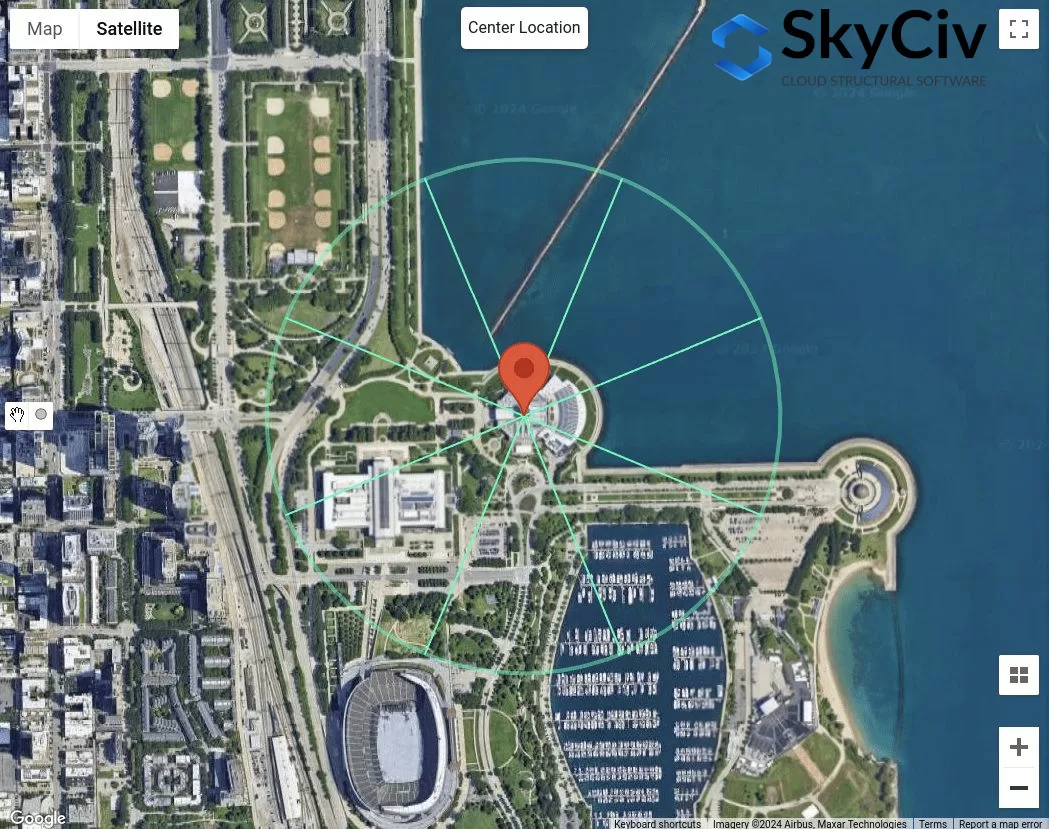
図 7. オフセット距離 1500 図を使用して、暴露 B の現場位置からのフィートを確認します 3.
図から 7, 風源の方向が北西であると判断できます。, W, SW, および S は、各方向セクターの表面粗さが表面粗さ B であるため、露出 B として分類されます。.
状態 4. 場合の条件 1 に 3 真実ではありません, したがって, 地形は露出 C です.
したがって, 風源方向SE用, 暴露カテゴリーCに分類されます. 要約すれば, 各風源方向の暴露カテゴリーを図に示します。 8 未満.
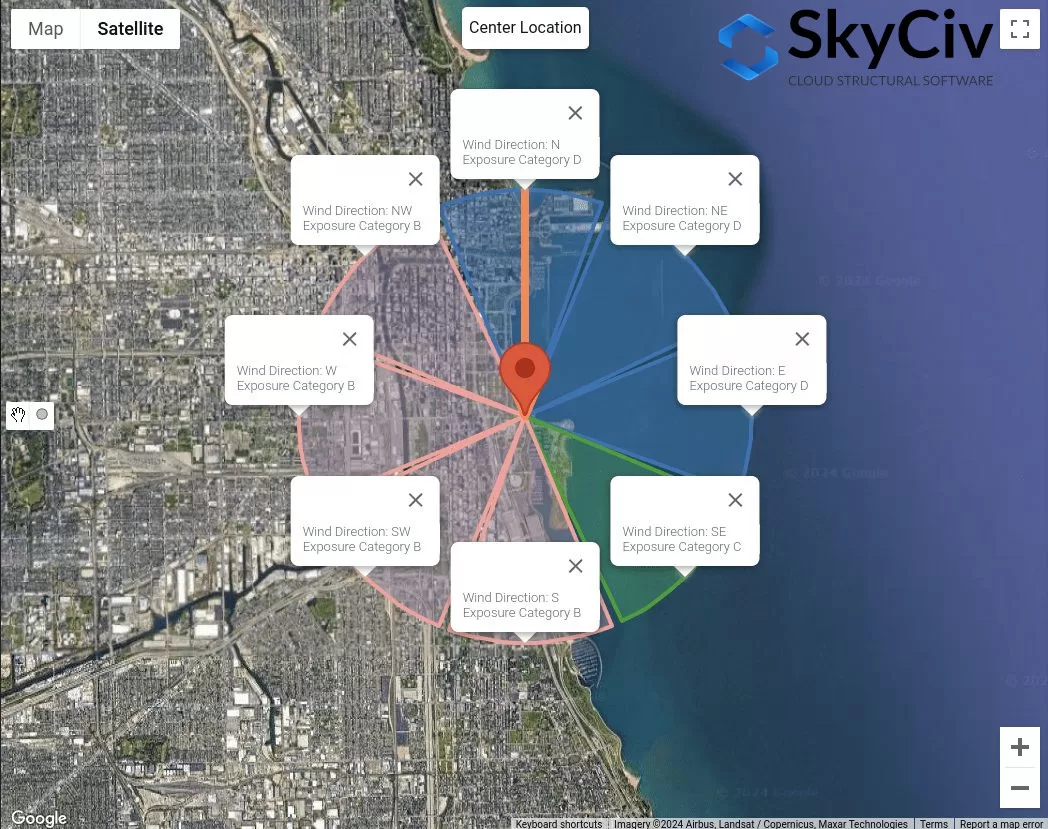
図 8. 風源方向ごとの暴露カテゴリー.
これらのデータは、速度圧力係数として最悪の風源方向を決定するために使用できます。 \( K_{と} \), 地形的要因 \( K_{t} \), とガスト効果係数 \( G \) 詳細な計算を使用すると、露出カテゴリーの影響を受けます.
NBCC 2015/2020
NBCC用 2015, サイトの場所の風上暴露の暴露カテゴリーを決定する手順については、セクションで説明します。 4.1.7.3(5), 地形に応じて. 風源方向ごとに, ±45°の範囲にある 2 つの風上セクターから分析する必要があります。.
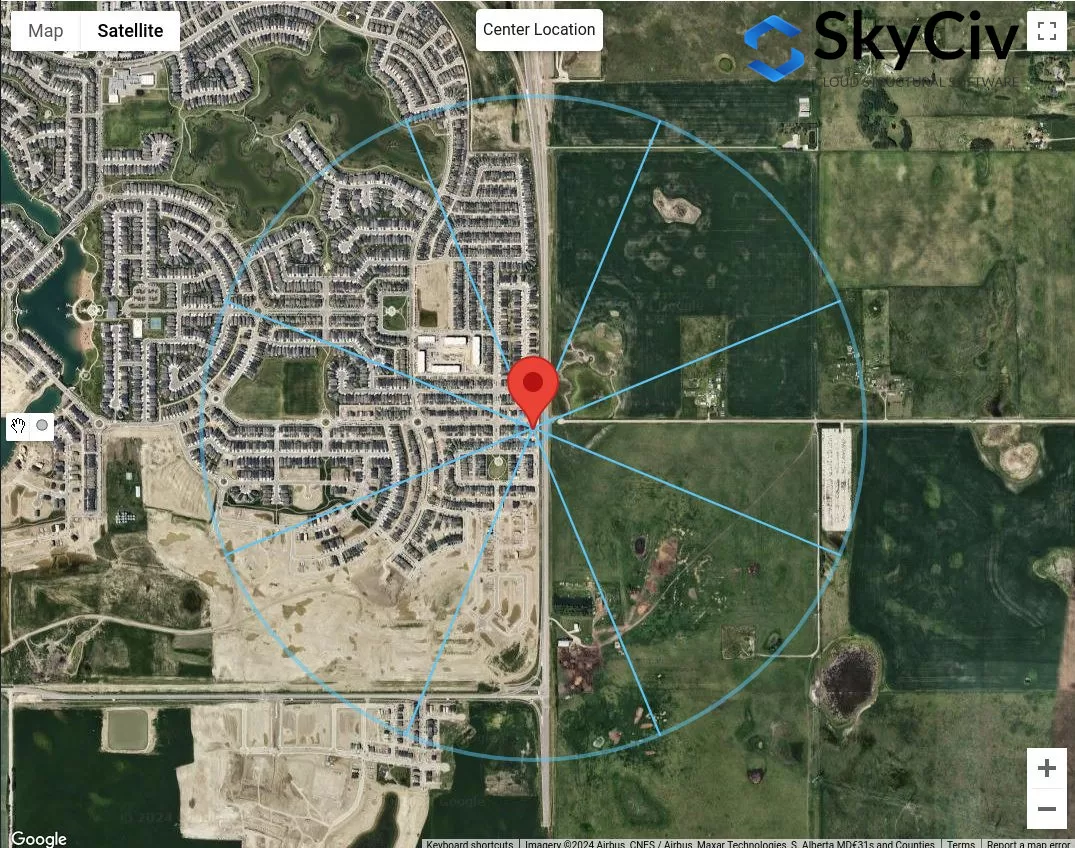
図 9. 各風源方向の地形セクター.
分野ごとに, 地形カテゴリは、セクションに基づく次の定義に基づいてチェックする必要があります。 4.1.7.3(5) NBCCの 2015:
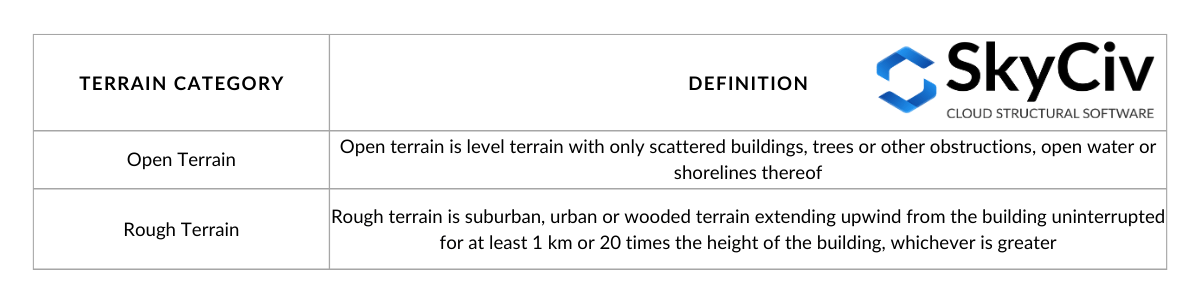
テーブル 3. セクションで定義されている地形カテゴリの定義 4.1.7.3(5) NBCCの 2015.
表のオプションを視覚化する 3:
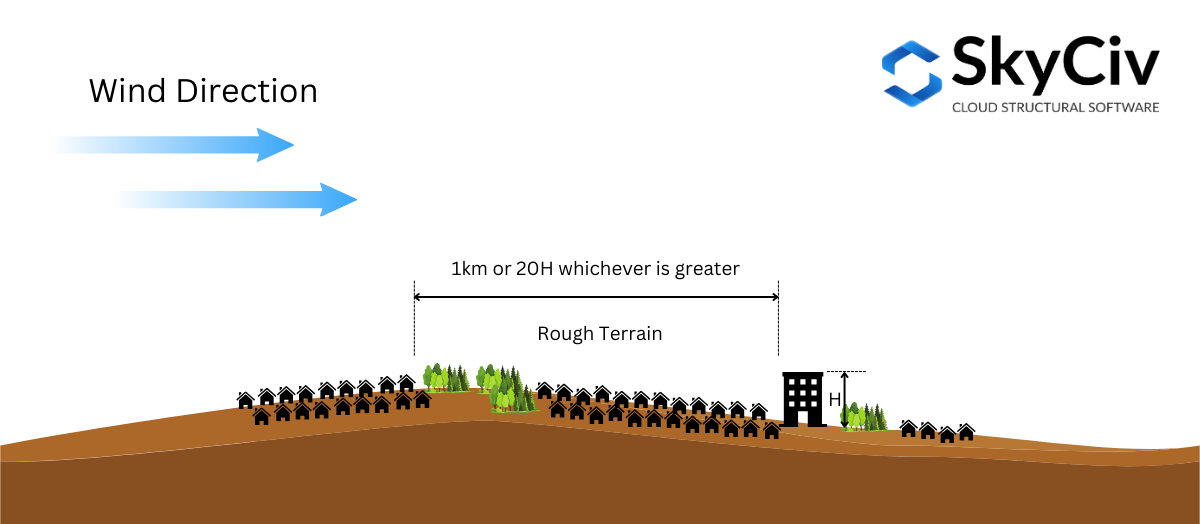
図 10. セクションで定義されている起伏のある地形の定義 4.1.7.3(5) NBCCの 2015.
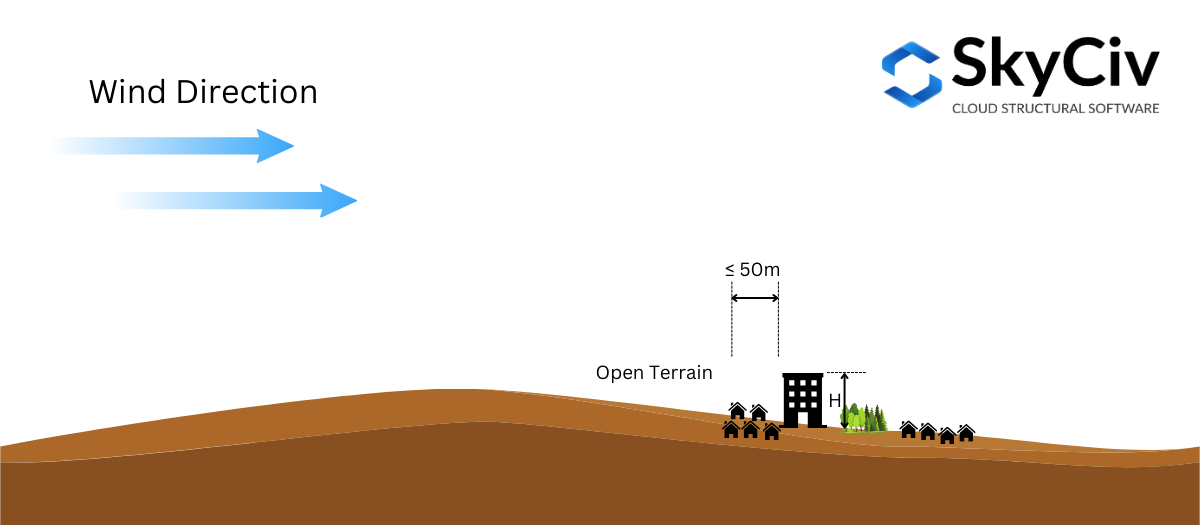
図 10. セクションで定義されているオープン テレインの定義 4.1.7.3(5) NBCCの 2015.
セクションに基づく 4.1.7.3(5) NBCCの 2015, 補間することは許可されています ばく露係数 \( C_{e} \) 中間の地形で. 構造物位置から不整地距離が 1km 以上の場合、または 20 構造物の高さの倍, どちらか大きい方, 地形は次のように考えることができます 起伏の多い地形, 距離が以下の場合 50 メートル, それは次のようにみなされます オープンテレイン. さもないと, 露出係数 \( C_{e} \) セクションごとに 4.1.7.3(5) 境界値から計算されます. これは図で視覚化できます。 11 未満.
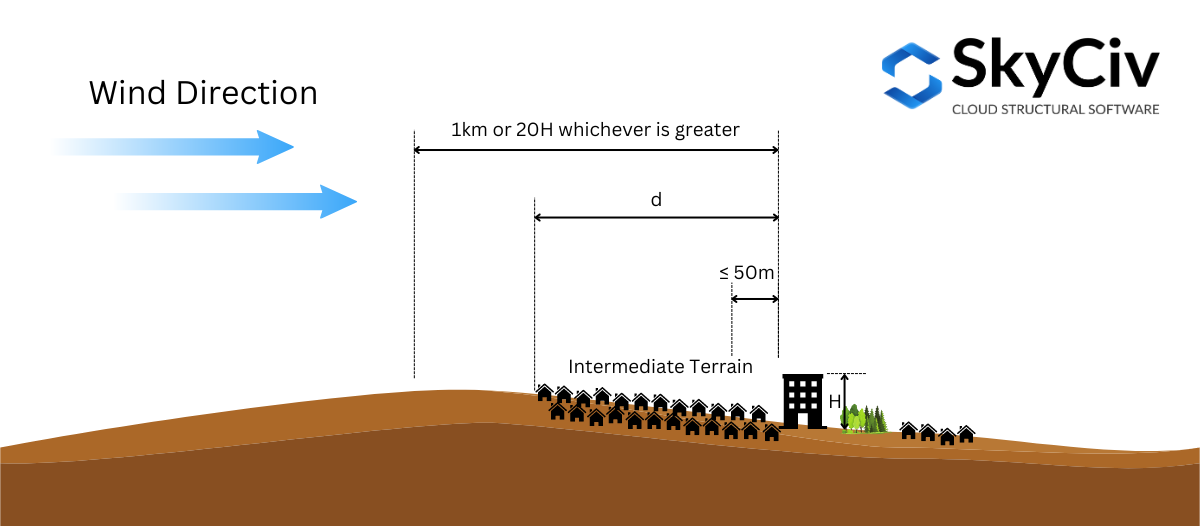
図 11. セクションで定義されている中間地形の定義 4.1.7.3(5) NBCCの 2015.
これをさらに説明すると、, サイトの場所の例を使用してみましょう – “657 マスターズ ロード SE, カルガリー, AB T3M 2B6, カナダ,” 構造物の高さを仮定すると \( H \) です 25 メートル ( \( 20H = 500 メートル \)).
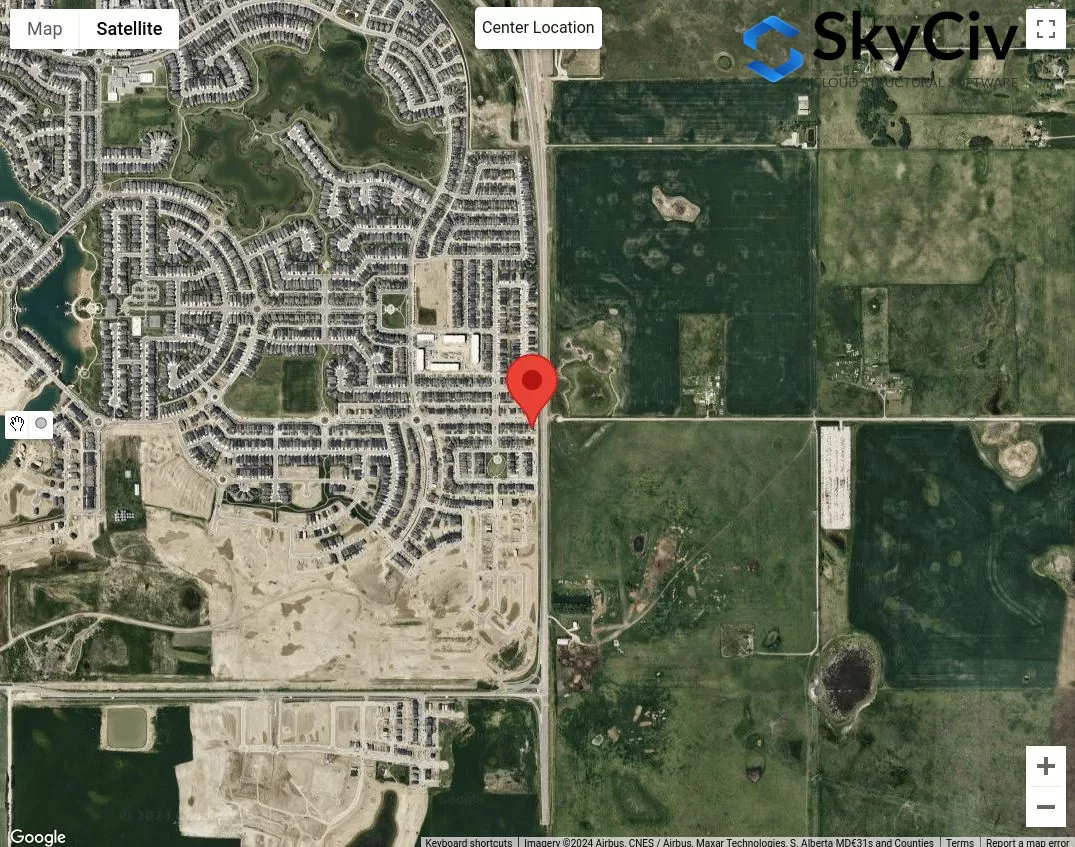
図 12. 地形カテゴリ分析のサンプル場所.
最初のステップは、風源の方向ごとに明らかな荒れた地形と開けた地形のカテゴリを分類することです。. 最大50mまで描画できます。 1 kmまたは \( 20 H \) 敷地の位置からの半径.
図 13. 表に基づいて地形カテゴリーを決定するためのオフセット距離 50m および 1km 1 定義.
図から 13, 風源の方向は 生まれ, E, とSE として分類されます 開けた地形 各方向の大まかな地形の長さがサイトの位置から 50m 未満であるため. しかも, 風源の方向について 西と北西 これらの方向の起伏のある地形の長さは より長いため、起伏のある地形として分類できます。 1 km. 風源方向用 N, この方向ではオープン テレインが優勢であると保守的に仮定できます。. 残りについては, SとSW, これらは中間地形であると結論付けることができ、サイトの位置から起伏のある地形までの距離を測定する必要があります。.
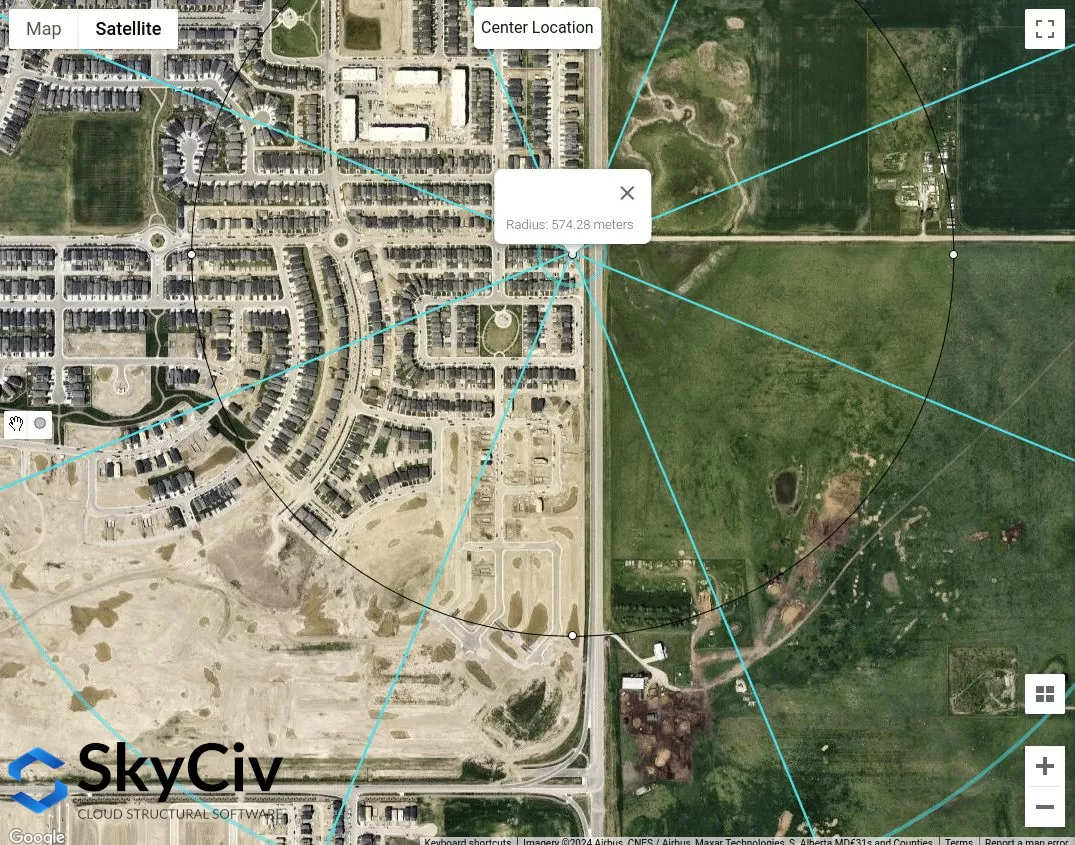
図 14. 西南の風源方向のサイトの位置から測定されたおおよその不整地形の長さは次のとおりです。 574 メートル.
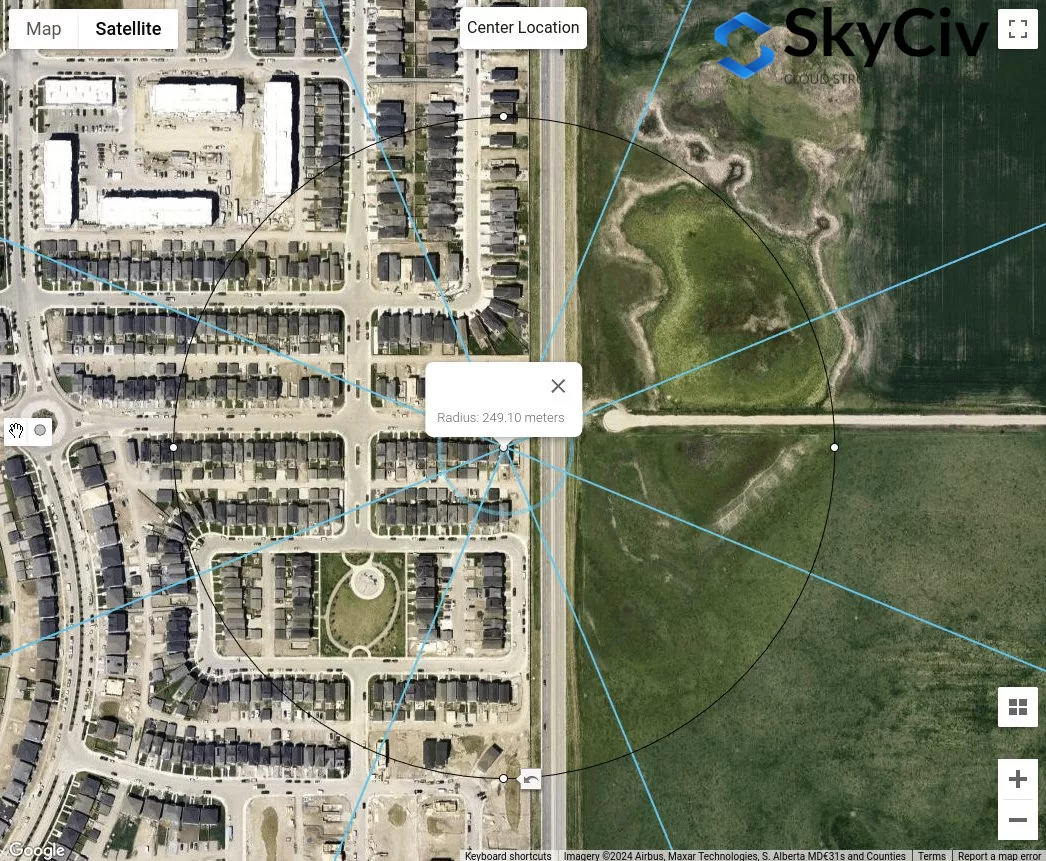
図 15. 南風源方向の敷地位置から測定したおおよその起伏のある地形の長さは次のとおりです。 249 メートル.
上記の分析から, オープンテレインを使用した風源の方向は間違いなく保守的な値を生成します. しかしながら, すべての風源方向が中間地形に分類される場合, 上記の手順は、各方向に適切な地形カテゴリを決定する方法です。.
AS / NZS 1170.2 (2021)
AS / NZSの場合 1170.2, 上記の参考文献と同じ手順が、サイトの場所の風上露出の地形カテゴリーを決定する際に適用されます。. これについてはセクションで説明します 4.2 AS / NZSの 1170.2 (2021). 風源方向ごとに, ±45°の範囲にある 2 つの風上セクターから分析する必要があります。. 各地形カテゴリの定義はセクションに基づいて以下に示されます。 4.2.1 AS / NZSの 1170.2 (2021):
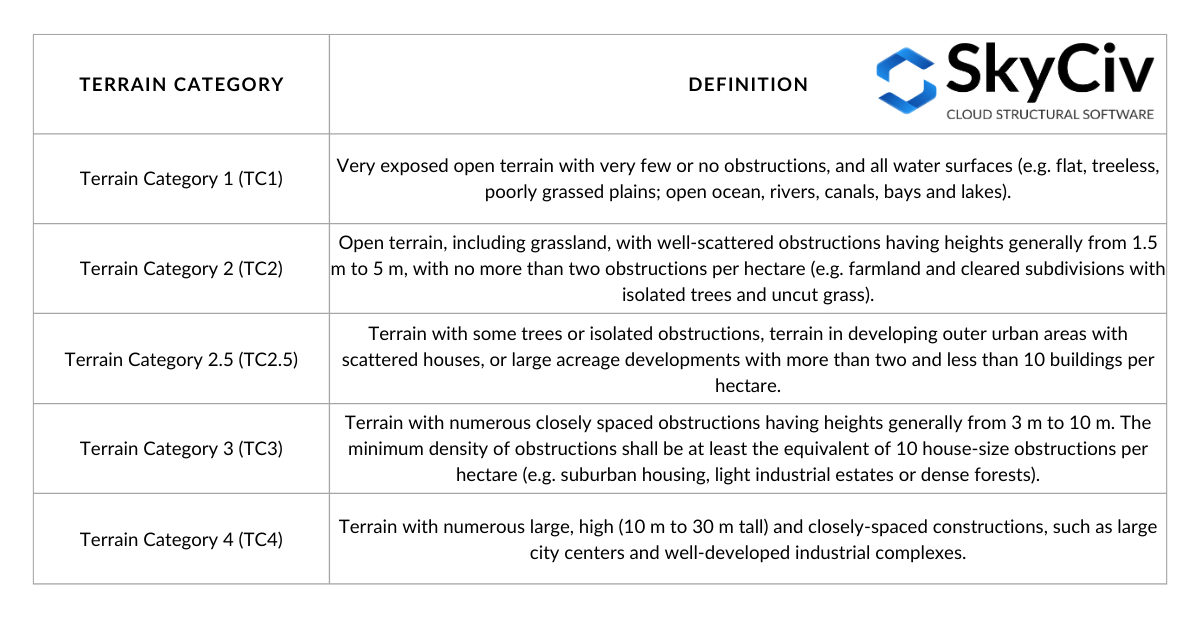
テーブル 4. セクションで定義されている地形カテゴリの定義 4.2.1 AS / NZSの 1170.2 (2021).
方向の地形カテゴリを決定する場合, に等しいラグ距離 \( 20 と \) 構造物からの位置は無視されます. この時点から, オフセット距離 (平均距離) の 500 または \( 40 z), どちらか大きい方, 図に示すように使用されます 16 未満. の \( と \) 値は屋根の平均高さに等しい, \( h \), 以下の場合 25 メートル. この平均距離内に複数の地形カテゴリが存在する可能性があります。, そしてそのように, を決定する際には、 の線形補間が使用されます。 \( M_{と,ネコ} \) 値, 各地形カテゴリの長さに応じて, 図に示すように 4.1 AS / NZSの 1170.2 (2021). 記事上で, 平均距離内の均質な地形カテゴリーのみを考慮します。.
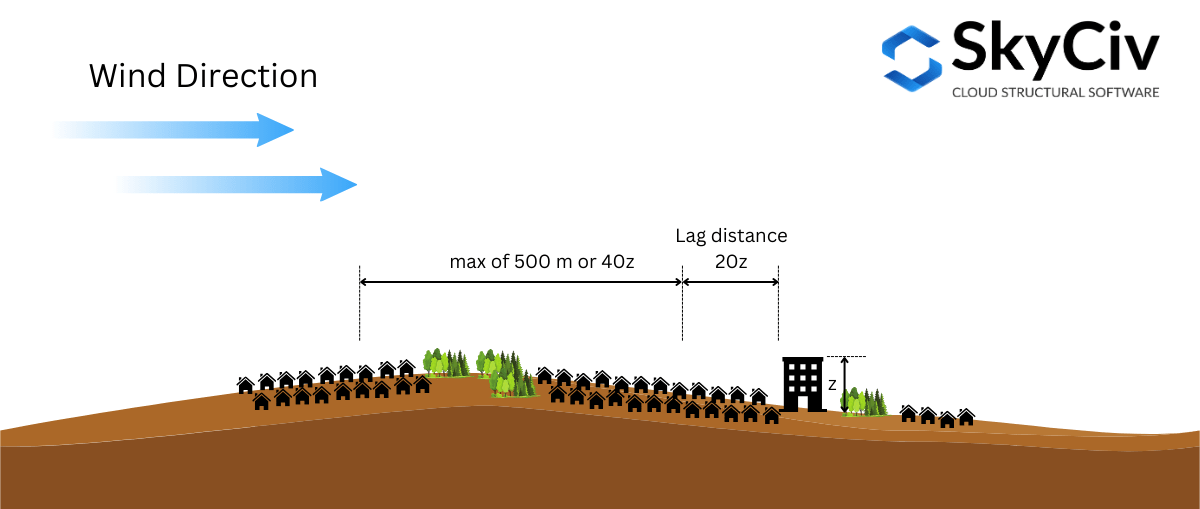
図 16. AS/NZS に基づいて地形カテゴリを決定する際に使用される距離の図 1170.2 (2021).
これをさらに説明すると、, サイトの場所の例を使用してみましょう – 緯度: 32°43'46″S ラング: 151°31’47″E – 屋根の平均高さを仮定すると \( h \) です 10 メートル ( どこ \( 20z = 20時間 = 200 メートル \) そして \( 40z = 400 メートル \)).
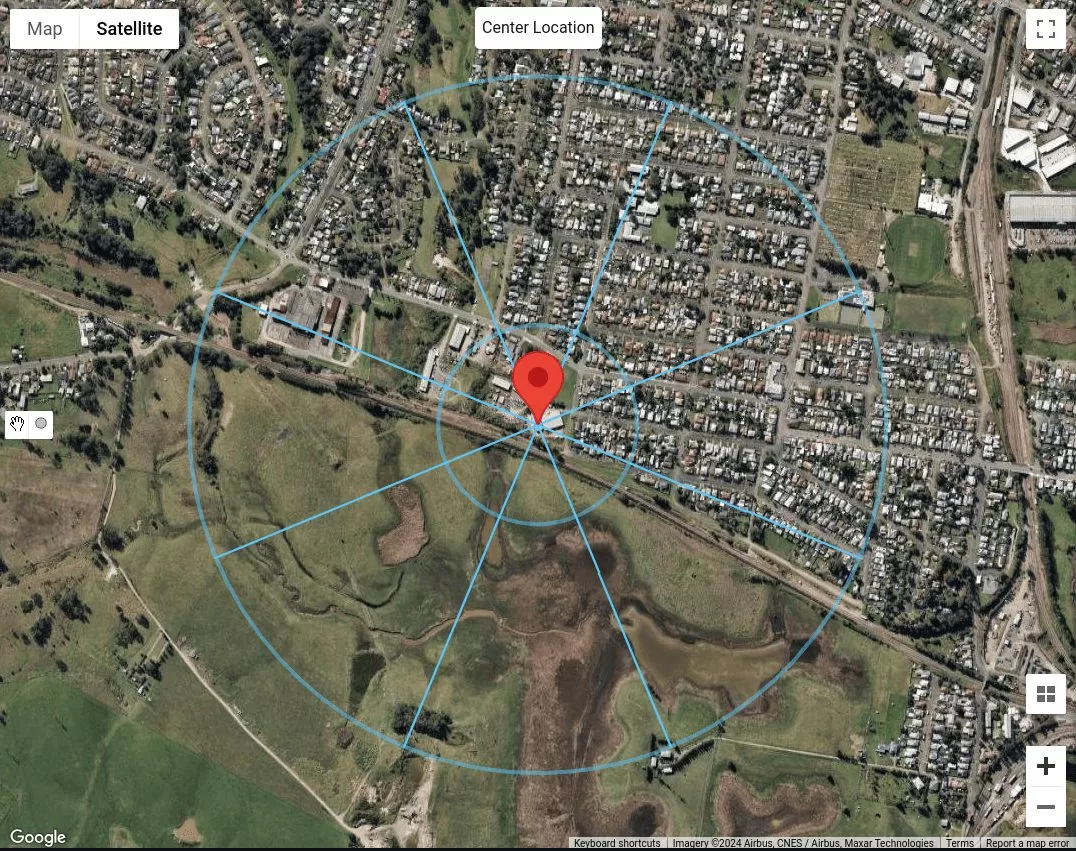
図 17. ラグ距離が等しいサイトの位置 200 m、平均距離は以下に等しい 500 風源方向ごとにm.
地形カテゴリーは 500 メートル全体にわたって均一であるとのみ考慮する必要があるため、 \( 40と \) 距離, 各風源の方向はすでに分類できています. N に建物があると仮定すると、, 北東と東, ある建物です 5 に 10 身長, これらを地形カテゴリに分類できます 3 (TC3) 表に示すように 4. 風源方向SE用, S, SW, そしてW, ここは障害物のない草原なので, これらを地形カテゴリとして分類できます。 1 (TC1). 最後に, 風源方向北西用, 2 つ以上、2 つ未満であると推測できます。 10 ヘクタールあたりの建物, 家が点在している. したがって, これを地形カテゴリとして分類できます 2.5 (TC2.5).
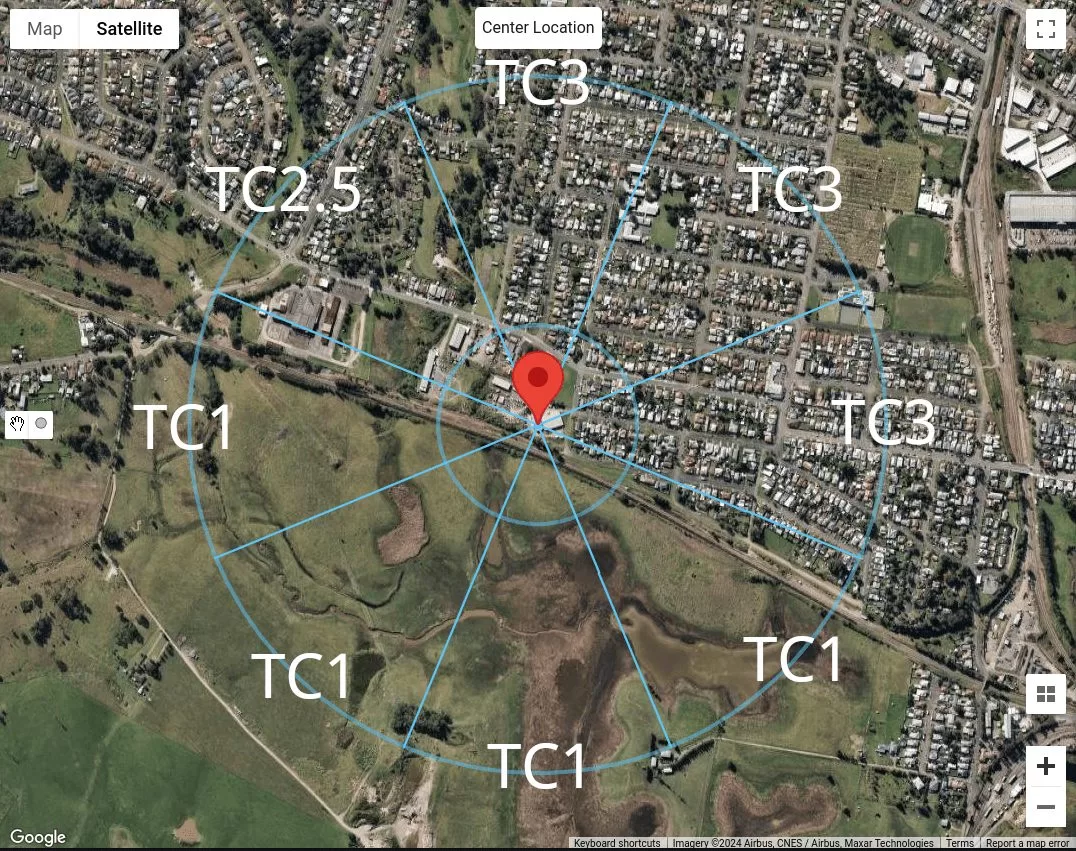
図 18. サンプル地点の風源方向ごとの地形カテゴリ分類の概要.
SkyCiv ロード ジェネレーターの使用
SkyCiv Load Generator バージョン v4.7.0 の場合, 新しいマップツールが導入されました – 距離を測定する そして 距離半径 ツール.
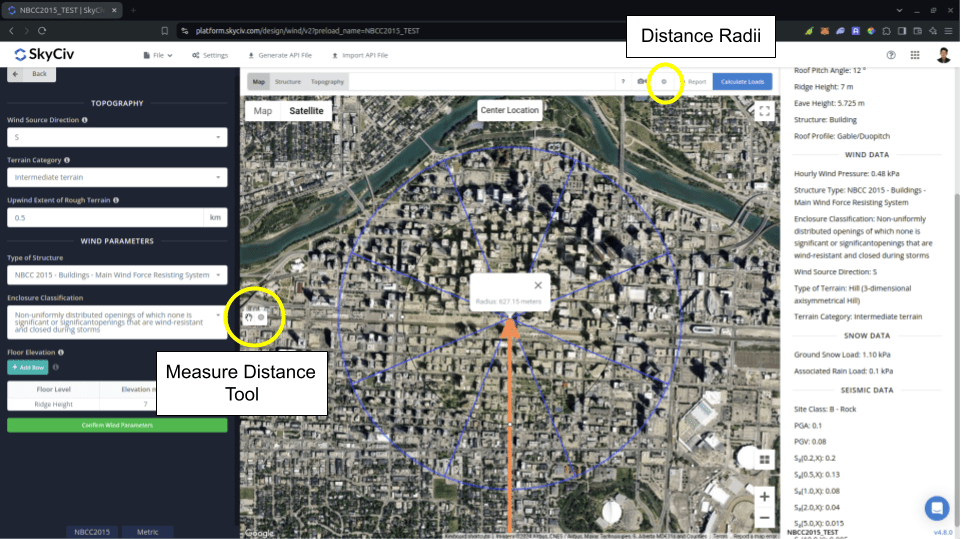
図 19. SkyCiv Load Generatorに距離測定ツールを導入.
の 距離を測定する このツールは、マップ内でクリックした点から円を生成し、その半径をメートル単位で表示するために使用されます。. こちらです, 特定の場所の分析対象の場所からの距離を測定できます. NBCCでの測定に使用できます 2015 のために 荒れた地形の風上範囲 計算に使用 ばく露係数 \( C_{e} \). 生成された円をクリックするとマップから消去されます.
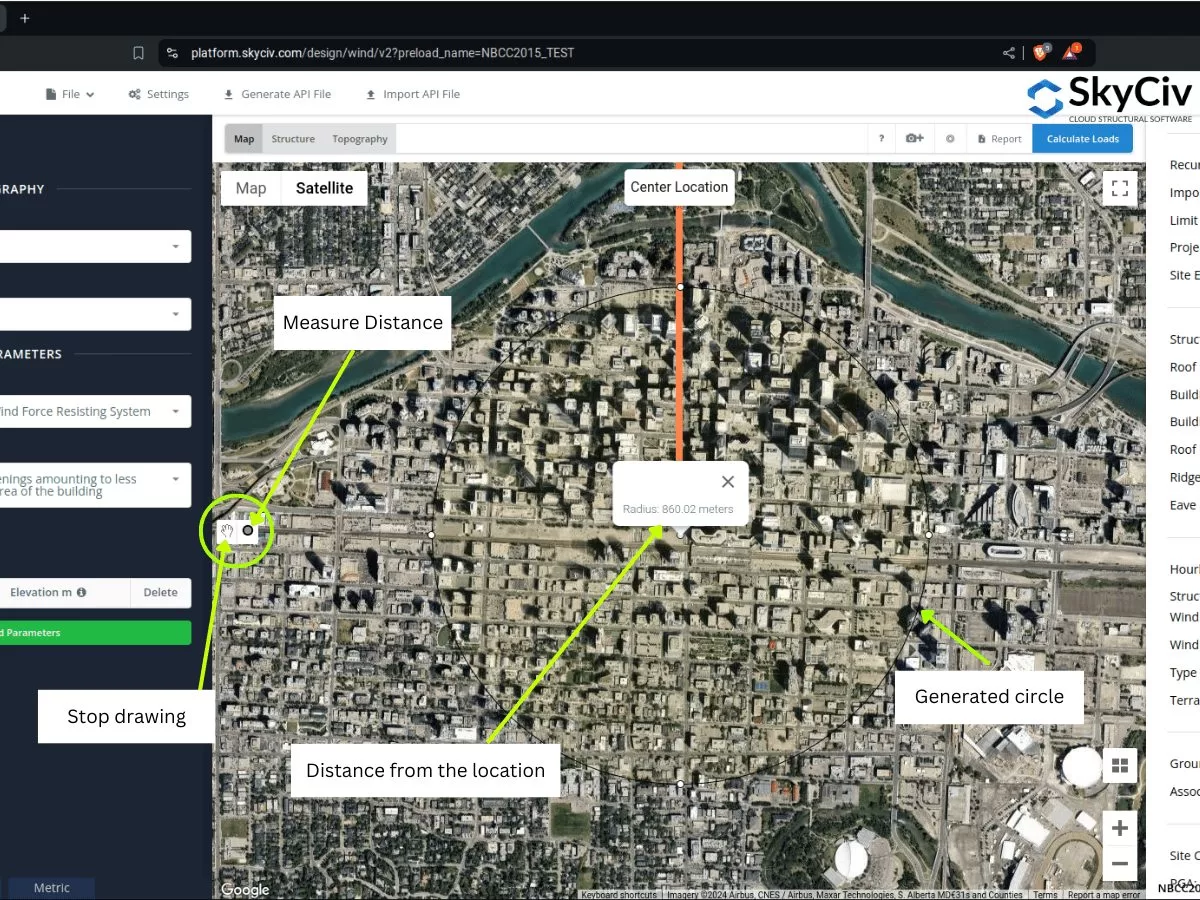
図 20. SkyCiv Load Generator に導入された位置からのオフセットを作成し、中心からの半径/オフセット距離を表示する距離測定ツール.
一方, の 距離半径 風力源カテゴリごとに、ユーザーが位置から指定された距離で円を描画できるように導入されました。. 地図上で距離半径を表示または非表示にするトグル ボタンです。, サイトの位置を円の中心として.
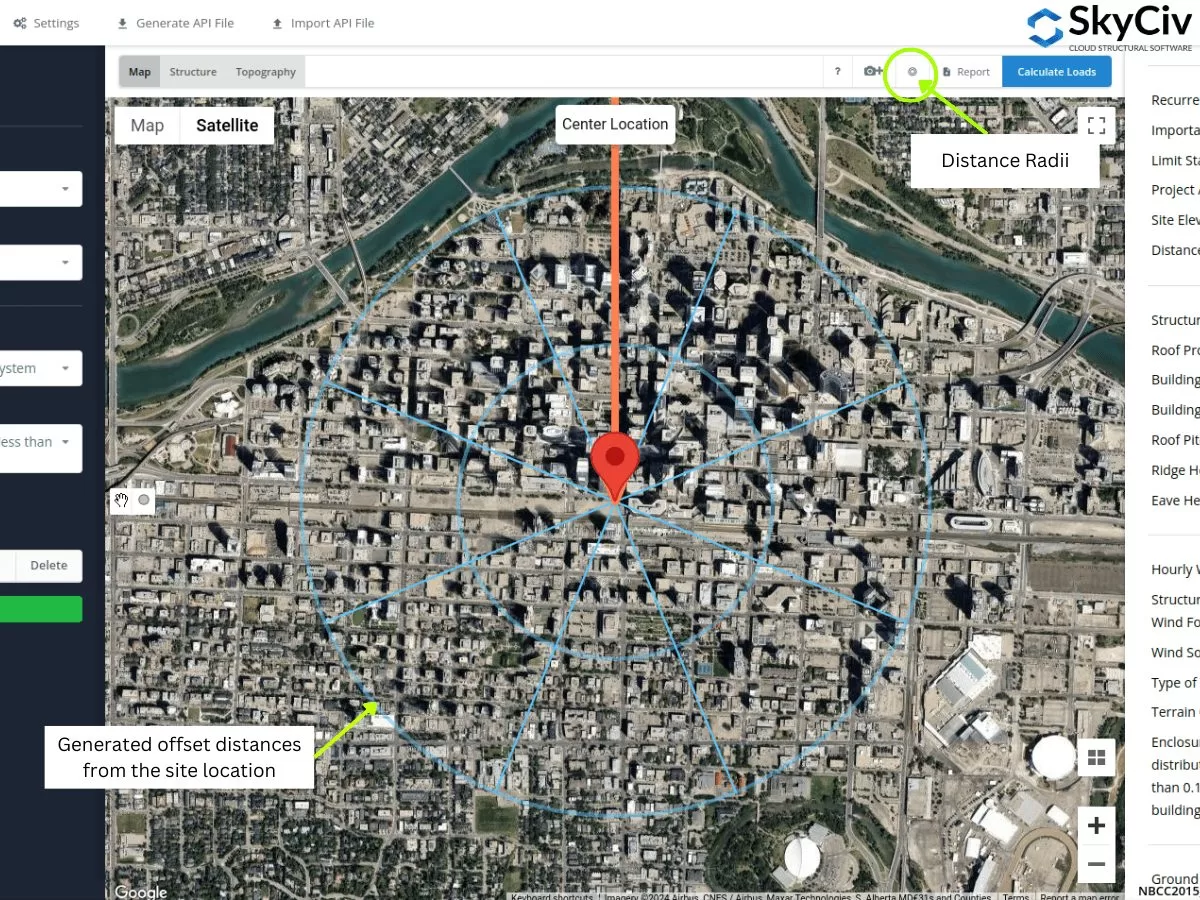
図 21. SkyCiv Load Generator に導入されたサイトの位置からのオフセット距離を指定する距離半径ツール.
半径の値は、設定を開いて編集できます。.
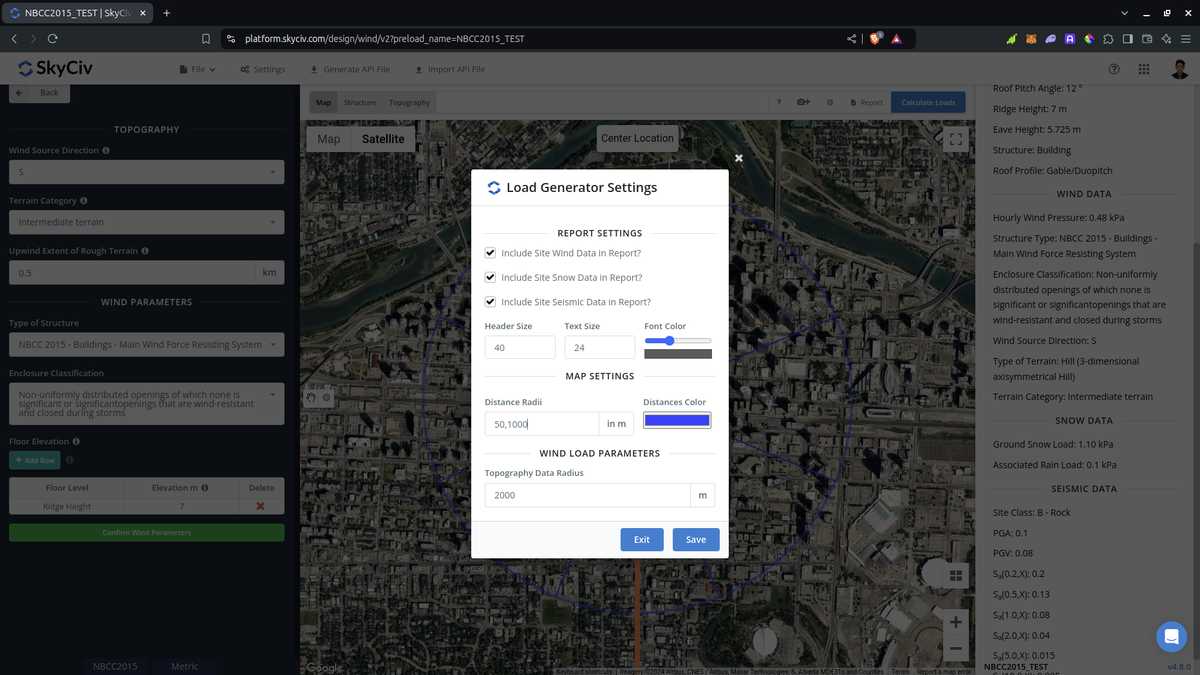
図 22. SkyCiv Load Generator の距離半径ツールの距離を編集する設定のオプション.
距離値はソフトウェアによって自動的に計算されないため、ユーザーが編集する必要があることに注意してください。. これを ASCE に使用する 7 およびNBCC, 各風源方向の最悪の曝露または地形カテゴリーが採用されるものとします。. AS/NZSでのご利用について 1170.2 (2021), ソフトウェアは平均を計算するために半径値を使用しません。 \( M_{と,ネコ} \) 値. 代わりに, 平均距離は、均一な地形カテゴリを割り当てることができる適用範囲として使用されます。, 風源方向ごとに最悪のカテゴリーを採用.
上で説明したセクションから, これらの新しいツールを使用して、風源の方向ごとに露出または地形のカテゴリを決定できます。. 上記の手順により、各風源方向の地形分類を簡単に得ることができます。. GIS および AI ツールの使用, 各風源方向に対して上記で使用した基準をさらに確認すると、より適切で効率的な結果が得られます。.

構造エンジニア, 製品開発
MS土木工学
参考文献:
- 建物およびその他の構造物の最小設計荷重. (2017). ASCE / SEI 7-16. アメリカ土木学会.
- カナダ国立研究評議会. (2015). カナダの建築基準法, 2015. カナダ国立研究評議会.
- オーストラリア規格 (2021), 構造設計アクション. 部 2 風のアクション, オーストラリア/ニュージーランド規格 AS/NZS1170.2:2021, オーストラリア規格, シドニー, ニューサウスウェールズ州, オーストラリア.
- の計算を説明するために