Neste artigo, Vamos orientá -lo no como determinar o terreno ou as categorias de exposição do lado do vento no local do site, que são essenciais para calcular cargas de vento. Abordaremos os procedimentos específicos descritos na ASCE 7, NBCC 2015, e AS / NZS 1170.2 Para determinar as categorias do terreno e discutir como elas se aplicam a cada código de referência disponível no gerador de carga Skyciv.
ASCE 7-16/ASCE 7-22
Para ASCE 7, O procedimento para determinar a categoria de exposição da exposição a favor do vento de um local do site é discutido na seção 26.7, Dependendo do terreno. Neste artigo, Para simplificar a referência, Estaremos usando ASCE 7-16. Para cada direção da fonte do vento, Deve ser analisado a partir de dois setores a favor do vento que se estende ± 45 °.
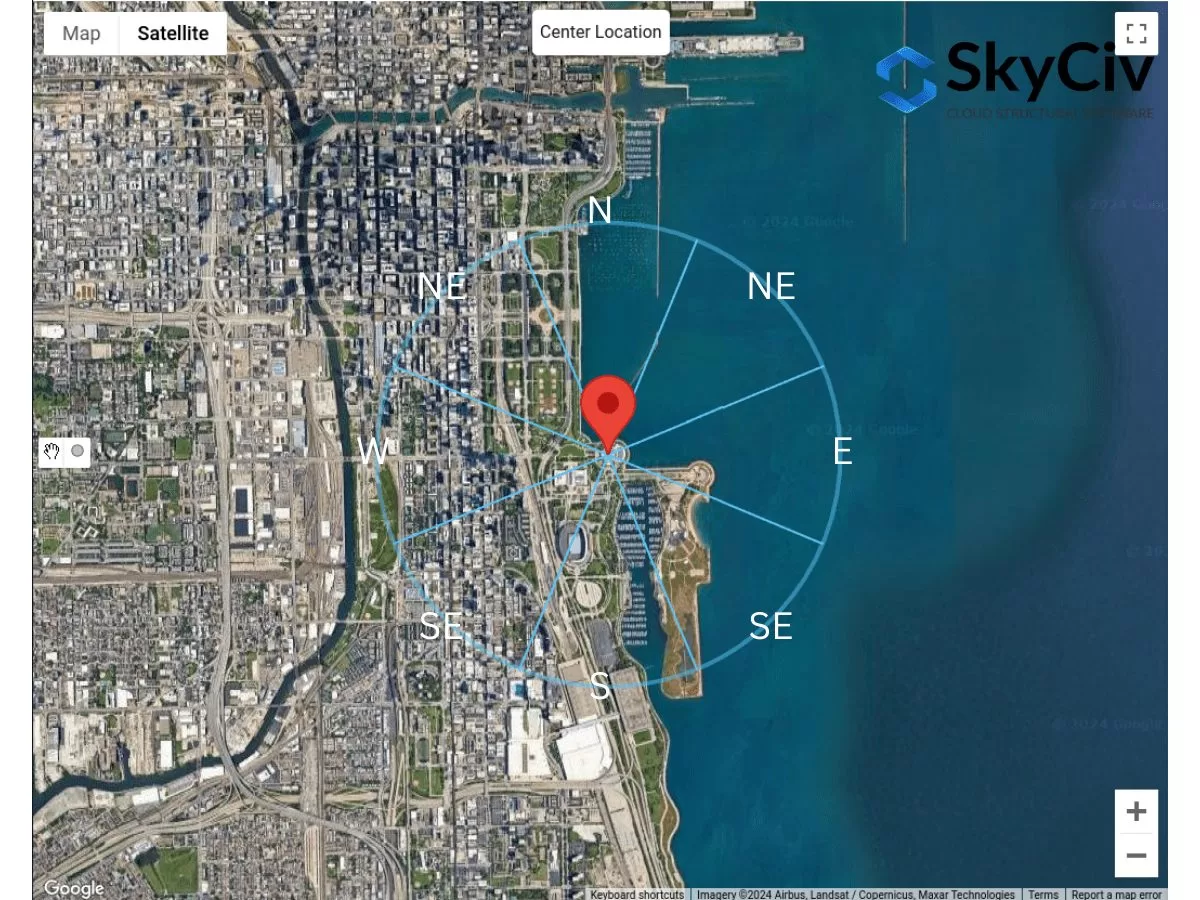
Figura 1. Setores de terreno para cada direção da fonte do vento.
Para cada setor, A categoria de rugosidade da superfície deve ser verificada com base na seguinte definição com base na seção 26.7.2 de ASCE 7-16:
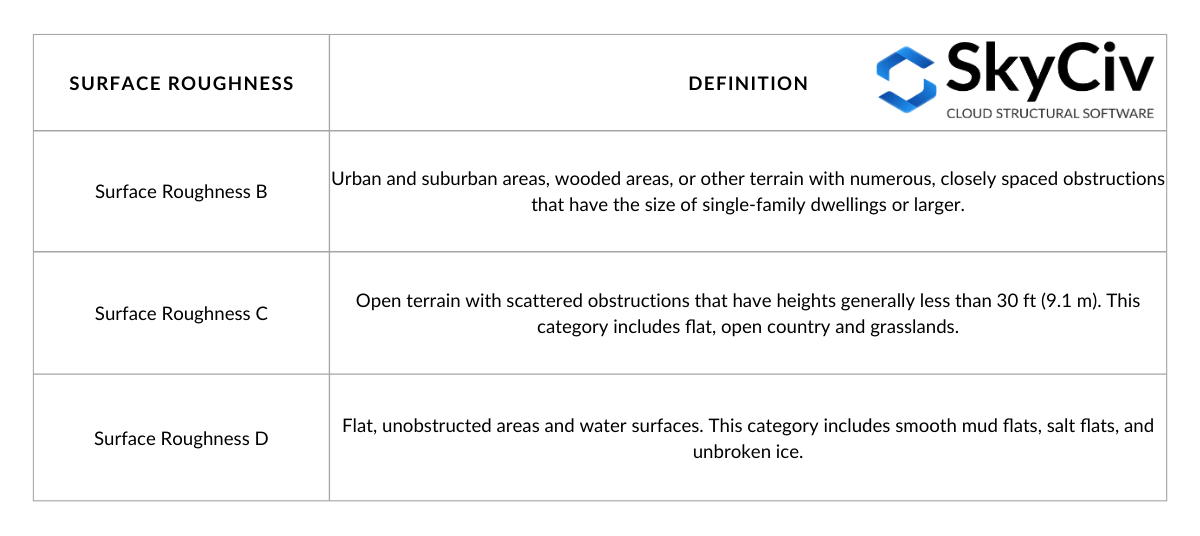
Tabela 1. Definição de rugosidade da superfície com base na seção 26.7.2 de ASCE 7-16.
Da definição de rugosidade da superfície, Podemos determinar a categoria de exposição do terreno delimitada pelo setor a favor do vento. A definição para cada categoria de exposição é declarada na seção 26.7.3 de ASCE 7-16 do seguinte modo:
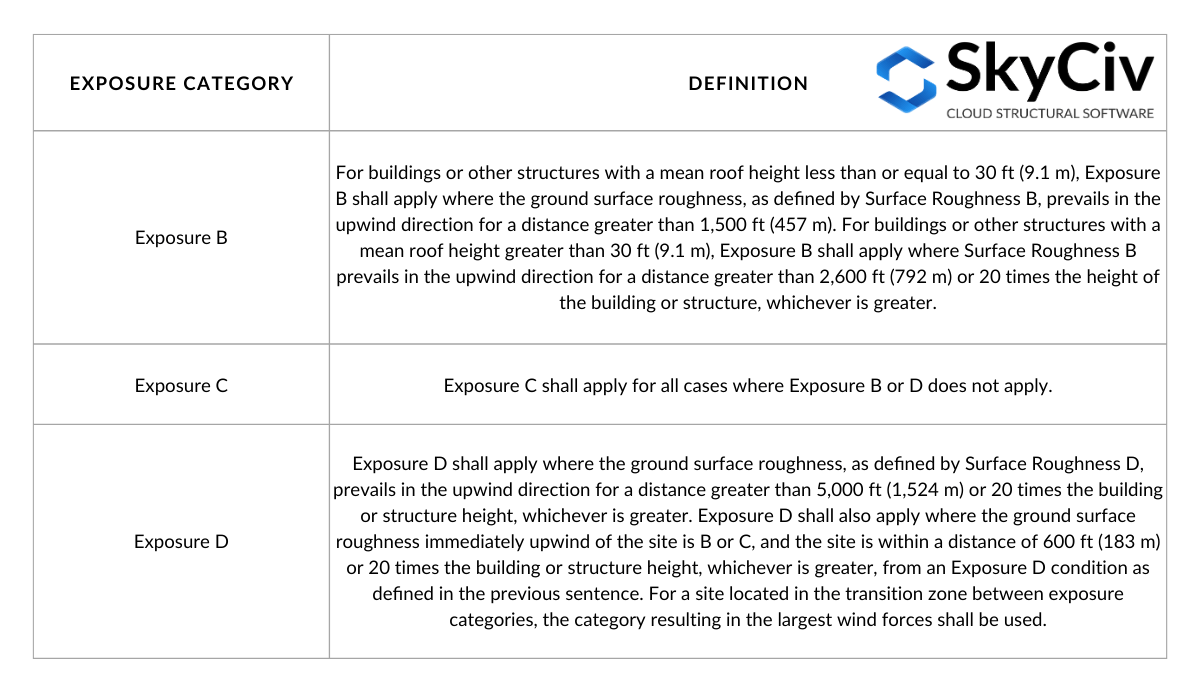
Tabela 2. Definição da categoria de exposição com base na seção 26.7.3 de ASCE 7-16.
A mesa 2 pode ser visualizado através das figuras a seguir com base na Figura C26.7-2:
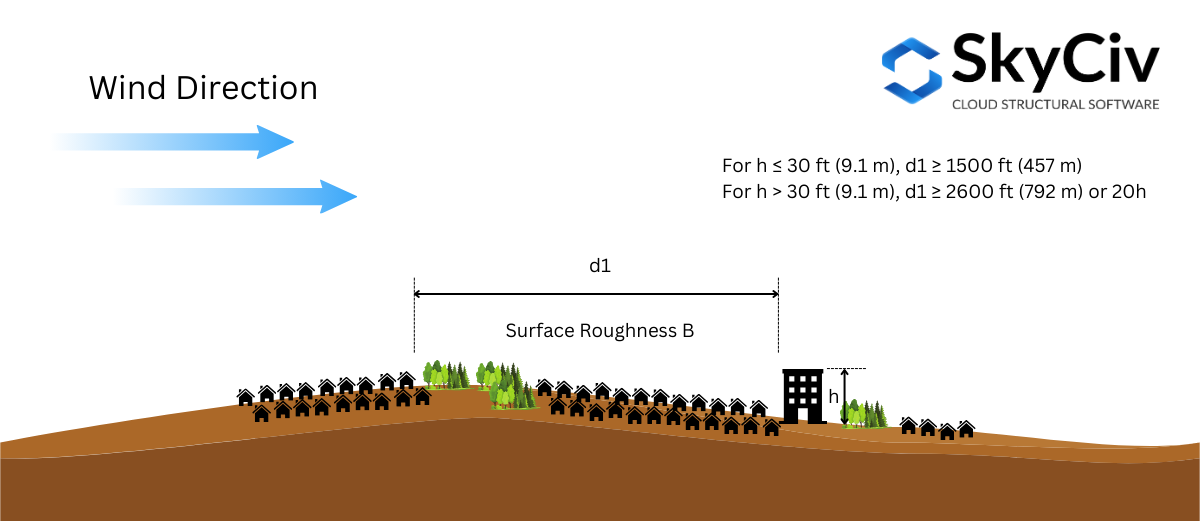
Figura 2. As condições de rugosidade da superfície a favor do vento necessárias para a exposição B.
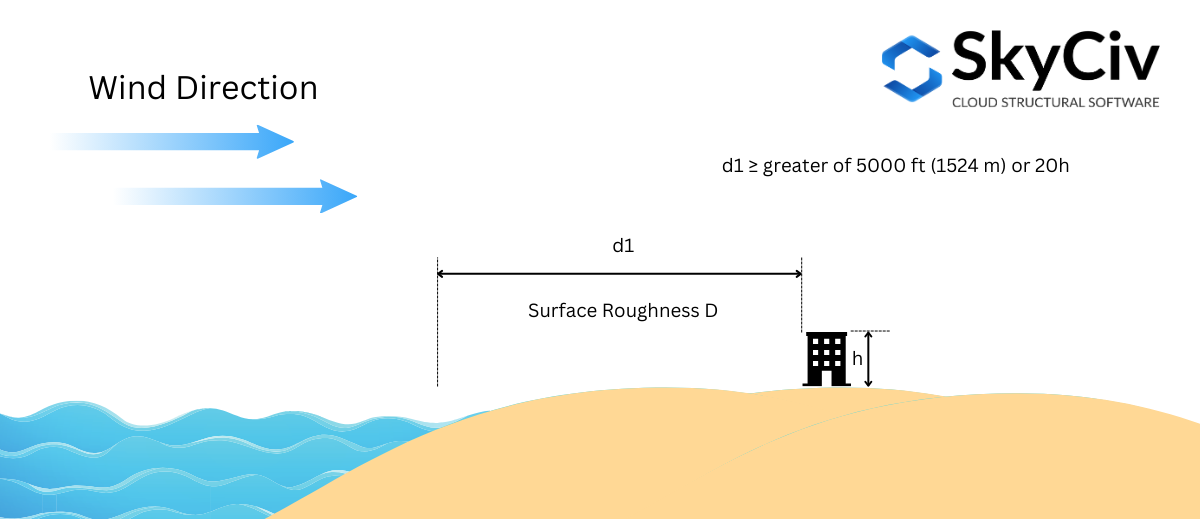
Figura 3. A rugosidade da superfície a favor do vento é necessária para a exposição D – caso 1.
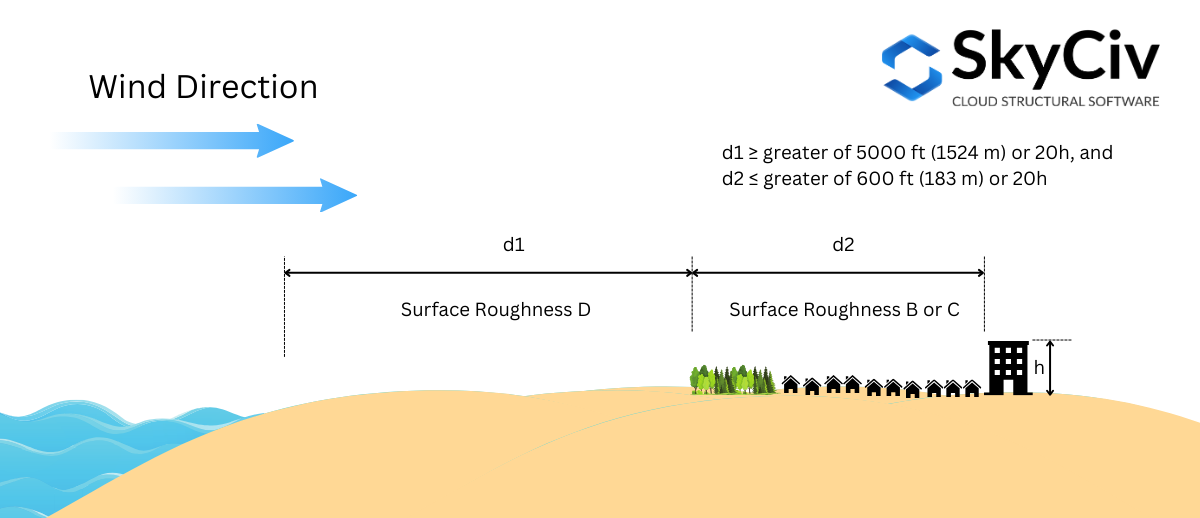
Figura 4. A rugosidade da superfície a favor do vento é necessária para a exposição D – caso 2.
A categoria de exposição deve ser determinada para cada direção da fonte do vento. Usando um exemplo de local do site – “1200 S Dusable Lake Shore Dr, Chicago, A 60605, EUA”, Vamos analisar isso para cada direção.
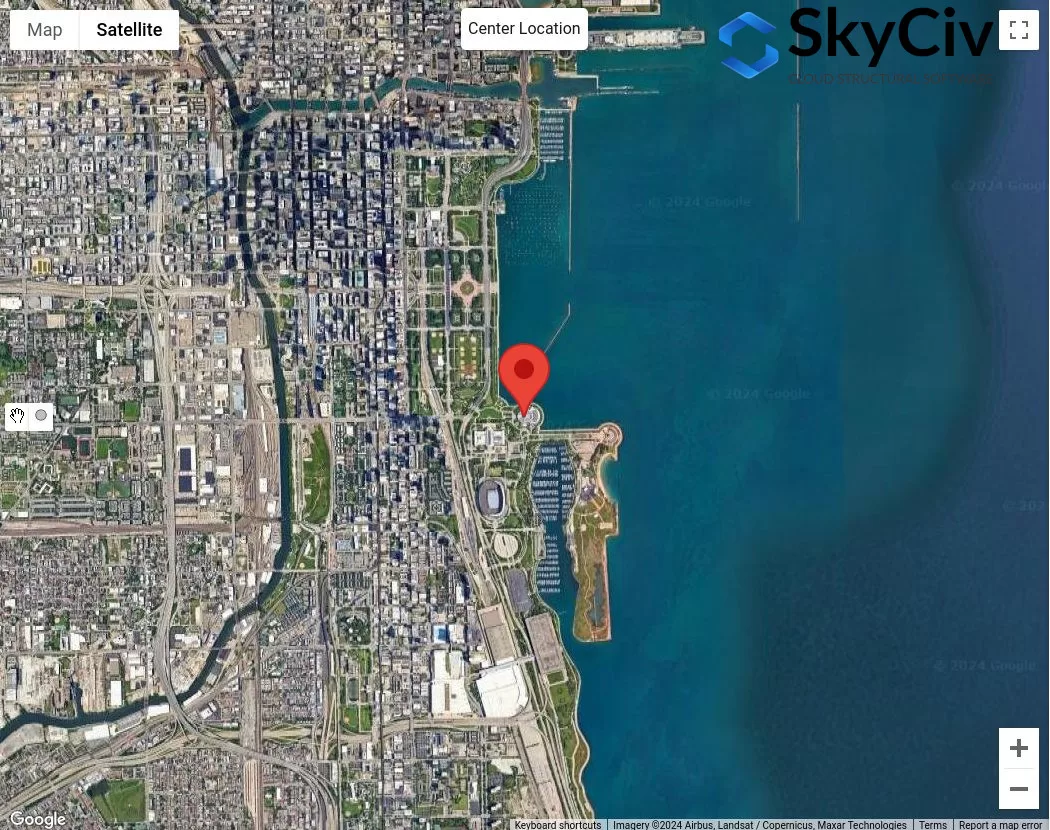
Figura 4. Localização da amostra para análise de categoria de exposição.
Assumindo que a altura média do telhado da estrutura é 25 ft ( \( 20h = 500 ft \)), Usaremos o seguinte procedimento para verificar a categoria de exposição para cada setor:
Doença 1. Determine se a exposição D usando a figura 3:
Usando a figura 3 – onde a distância \( d_{1} \) é 5000 ft (1524 m), Precisamos verificar a exposição D, onde a rugosidade da superfície D é dominante para o todo 5000 ft alongamento:
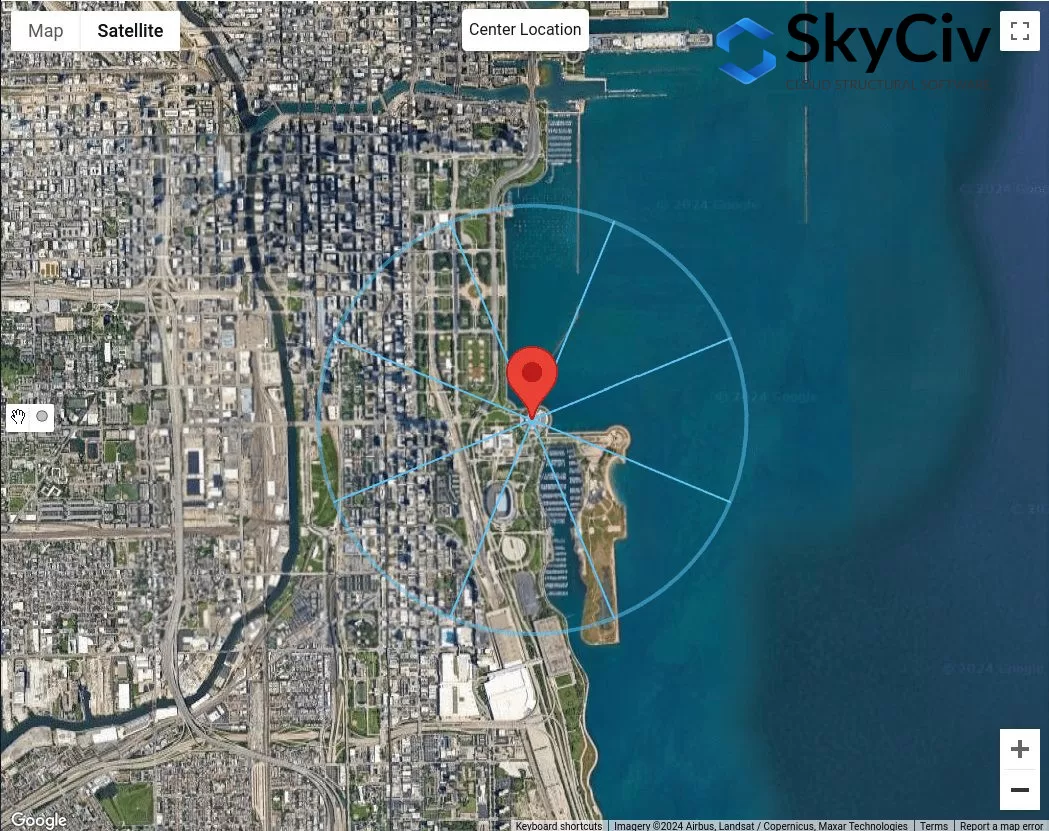
Figura 5. Distância deslocada de 5000 ft do local do local para a exposição D verificação usando a figura 3.
Da Figura 5, Já podemos concluir que as direções da fonte do vento N, NASCIDO, e E tem rugosidade da superfície d para o todo 5000 ft alongamento. Portanto, Essas direções da fonte do vento são Exposição D.
Doença 2. Determine se a exposição D usando a figura 2
Usando a figura 4 – onde a distância \( d_{1} \) é 5000 ft (1524 m) e distância \( d_{2} \) é igual a 600 ft (183 m), Precisamos verificar a exposição D. Da Figura 5, Isso só pode ser aplicado para a direção da fonte do vento de SE:
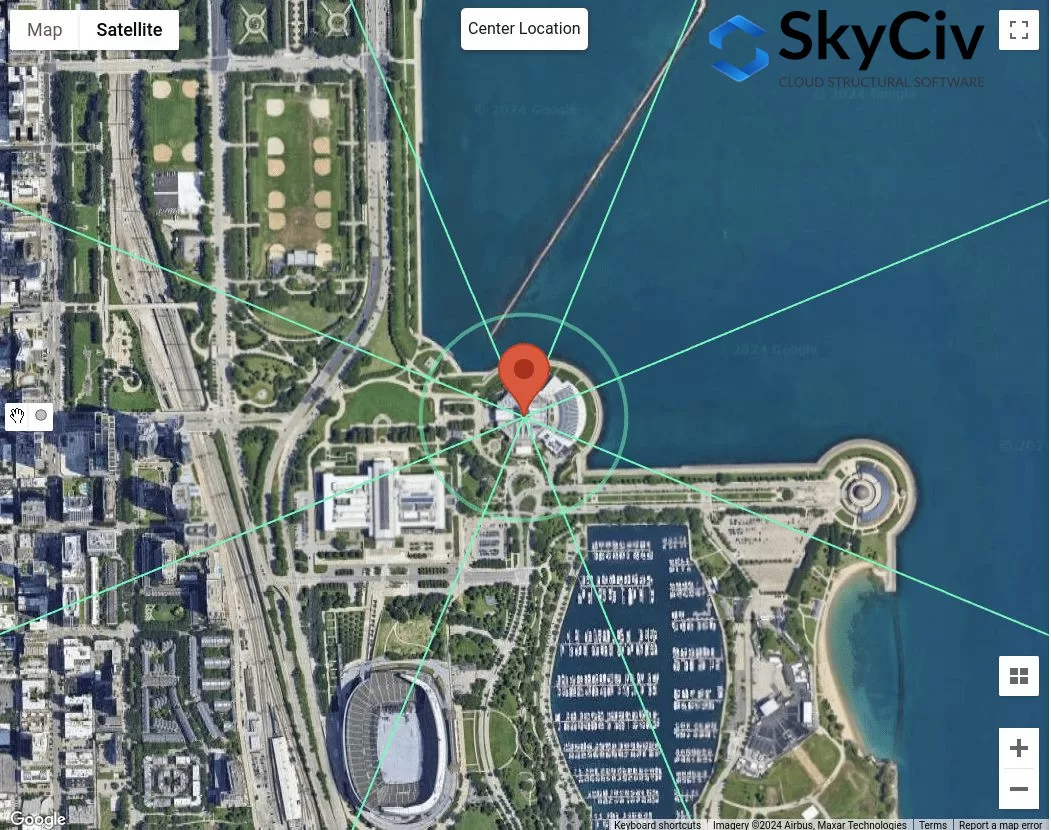
Figura 6. Distância deslocada de 600 pés e adicional 5000 ft do local do local para a exposição D verificação usando a figura 4.
Para a direção da fonte do vento se, usando \( d_{2} = 600 ft \), Podemos considerar que esta seção é rugosidade da superfície B. Contudo, para distância \( d_{1} = 5000 ft \), A seção não é 100% Rugosidade da superfície d. Conseqüentemente, SE não deve ser considerado como exposição D.
Doença 3. Determine se a exposição B usando a figura 1
Usando a figura 3 – onde a distância \( d_{1} \) é 1500 ft (457 m) optimizada \( h < 30 ft \), Precisamos verificar a exposição B.
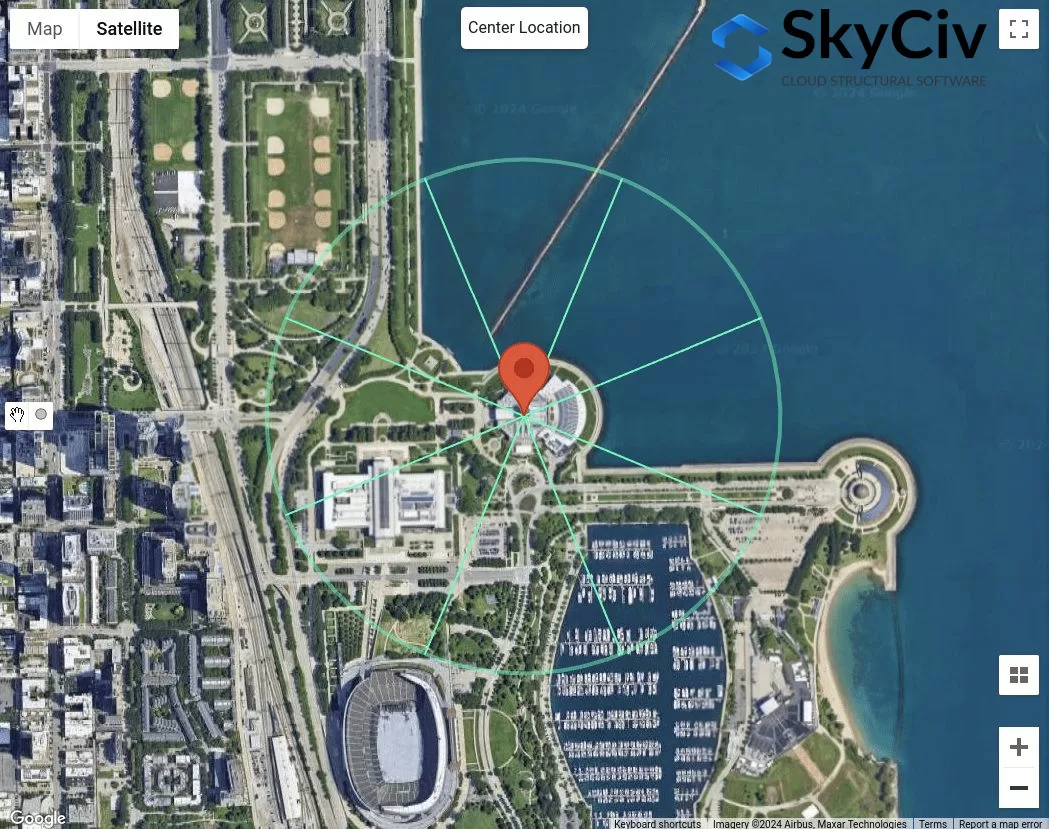
Figura 7. Distância deslocada de 1500 ft da localização do site para a exposição b verificação usando a figura 3.
Da Figura 7, Podemos determinar isso para as direções da fonte do vento nw, C, Antes de carregar sua estrutura, e S são classificados como exposição B como rugosidade da superfície para cada setor de direção é a rugosidade da superfície B.
Doença 4. Se condições 1 para 3 não são verdadeiros, Portanto, O terreno é a exposição c.
Portanto, para a direção da fonte do vento se, é classificado como categoria de exposição C. Resumindo, As categorias de exposição para cada direção da fonte do vento são mostradas na figura 8 abaixo.
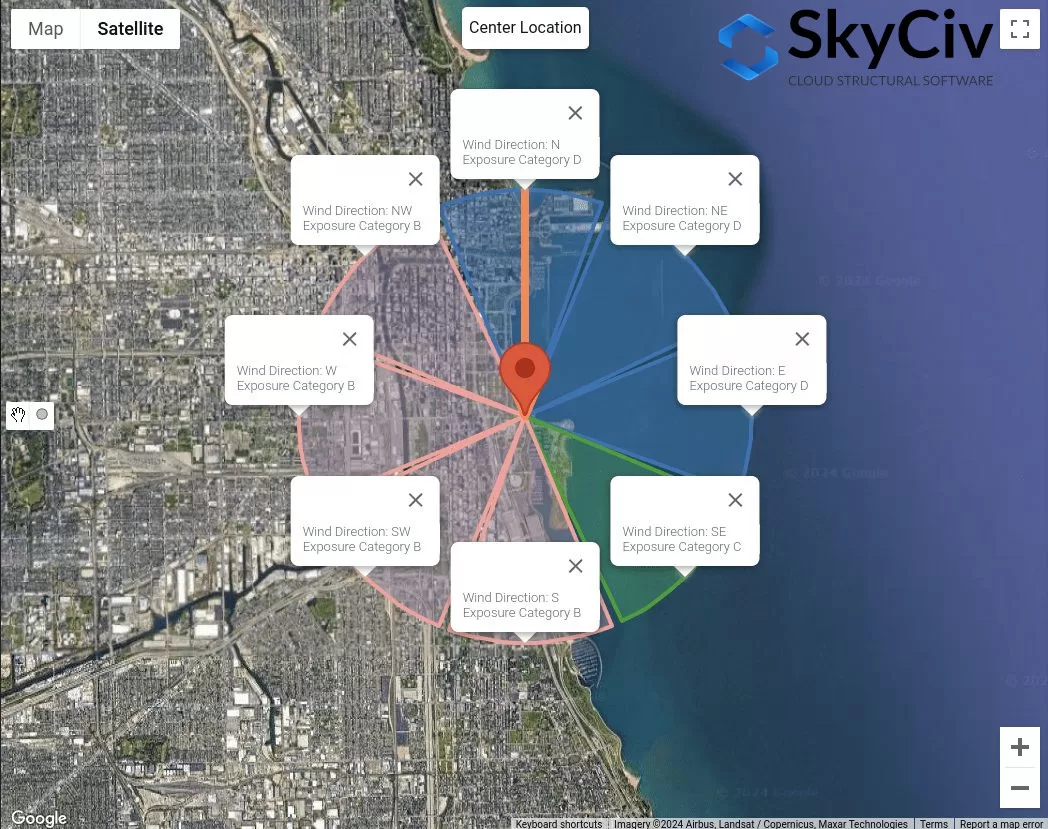
Figura 8. As categorias de exposição para cada direção da fonte do vento.
Esses dados podem ser usados para determinar qual será a pior direção da fonte do vento como os coeficientes de pressão de velocidade \( A seguir estão as diferentes maneiras de determinar os coeficientes de pressão de terra para calcular a resistência ao atrito unitária de estacas em areia{z} \), Fator Topográfico \( A seguir estão as diferentes maneiras de determinar os coeficientes de pressão de terra para calcular a resistência ao atrito unitária de estacas em areia{t} \), e fator de efeito de rajada \( G \) Usando o cálculo detalhado é afetado pela categoria de exposição.
NBCC 2015/2020
Para NBCC 2015, O procedimento para determinar a categoria de exposição da exposição a favor do vento de um local do site é discutido na seção 4.1.7.3(5), Dependendo do terreno. Para cada direção da fonte do vento, Deve ser analisado a partir de dois setores a favor do vento que se estende ± 45 °.
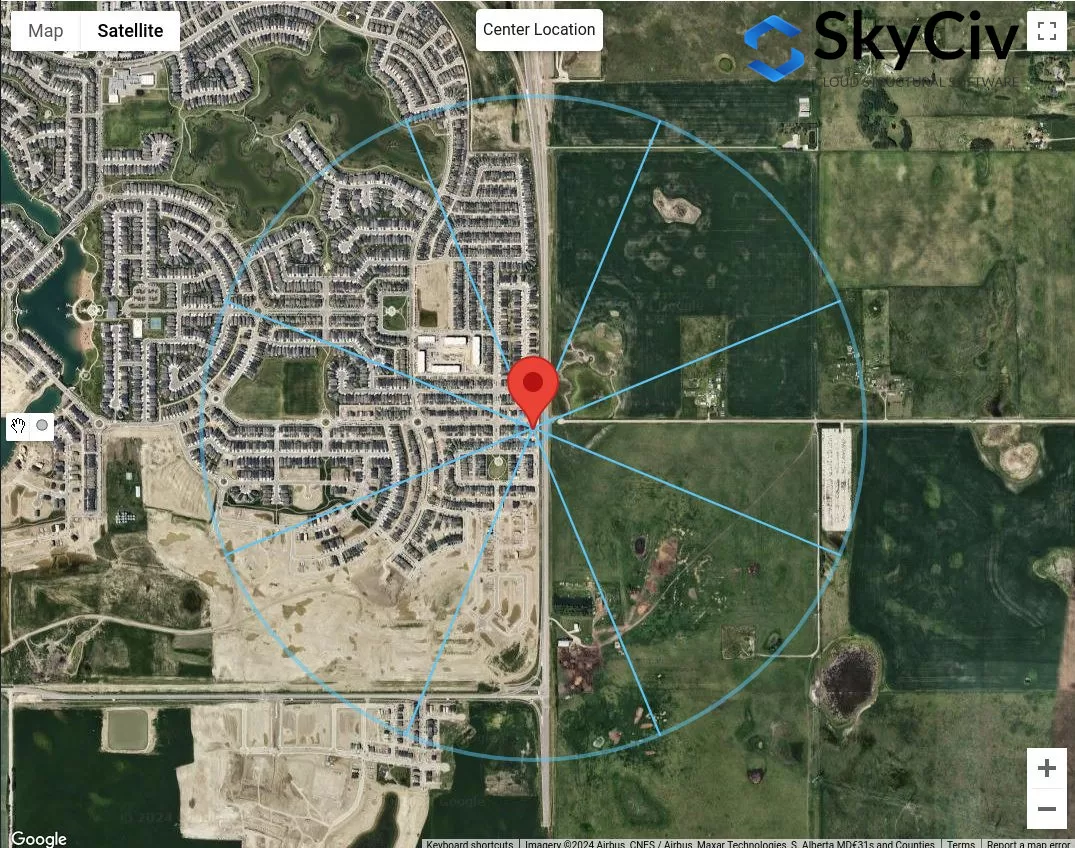
Figura 9. Setores de terreno para cada direção da fonte do vento.
Para cada setor, A categoria de terreno deve ser verificada com base na seguinte definição com base na seção 4.1.7.3(5) da NBCC 2015:

Tabela 3. Definição de categorias de terreno, conforme definido na seção 4.1.7.3(5) da NBCC 2015.
Visualizando as opções na tabela 3:
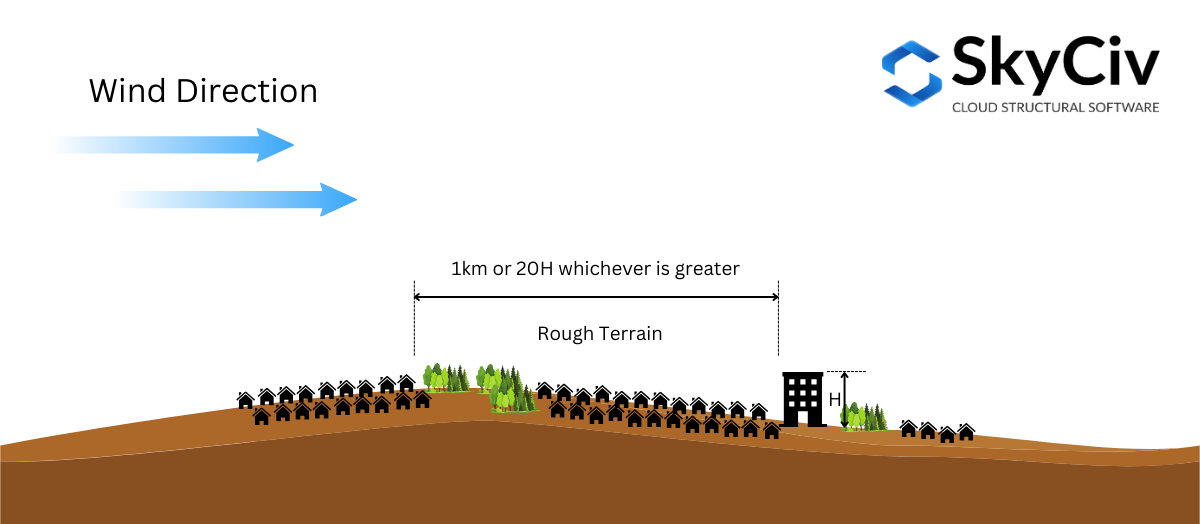
Figura 10. Definição de terreno acidentado, conforme definido na seção 4.1.7.3(5) da NBCC 2015.
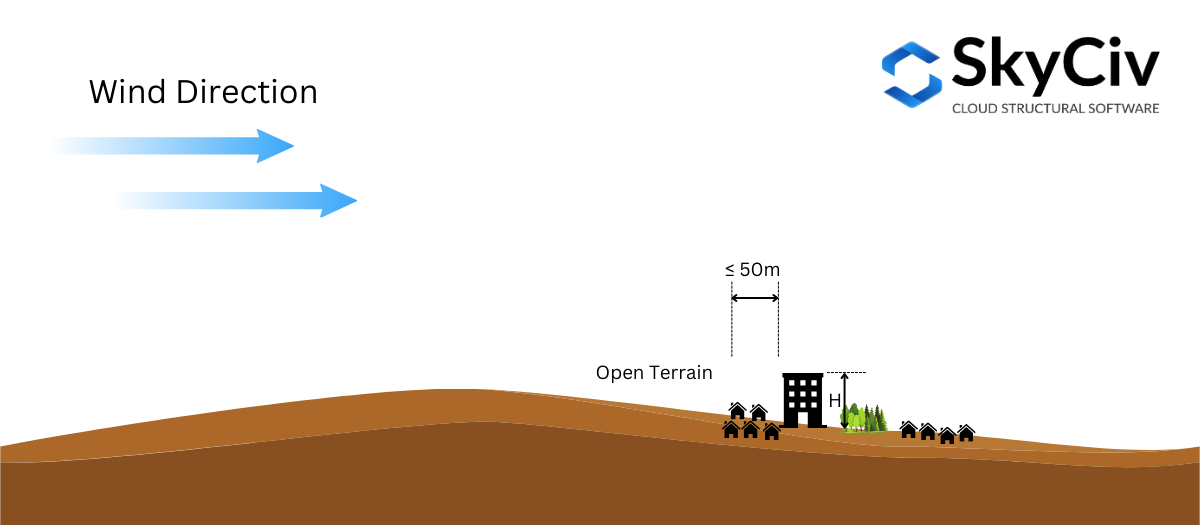
Figura 10. Definição de terreno aberto, conforme definido na seção 4.1.7.3(5) da NBCC 2015.
Com base na seção 4.1.7.3(5) da NBCC 2015, é permitido interpolar o Fator de Exposição \( C_{e} \) em terreno intermediário. Se a distância do terreno acidentado da localização da estrutura for maior ou igual a 1 km ou 20 vezes a altura da estrutura, o que for maior, o terreno pode ser considerado como Terreno acidentado, e se a distância for menor que 50 m, é considerado como Terreno Aberto. Caso contrário, o fator de exposição \( C_{e} \) de acordo com a seção 4.1.7.3(5) será calculado a partir dos valores de limite. Isso pode ser visualizado na figura 11 abaixo.
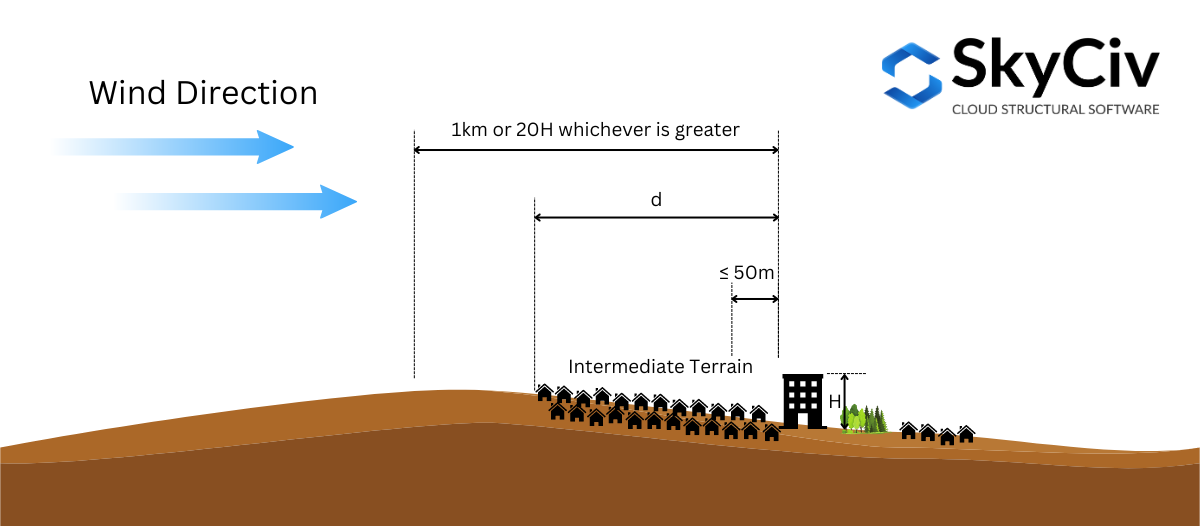
Figura 11. Definição de terreno intermediário, conforme definido na seção 4.1.7.3(5) da NBCC 2015.
Para ilustrar ainda mais isso, Vamos usar um exemplo de local do site – “657 Masters Rd SE, Calgary, AB T3M 2B6, Canadá,” assumindo a altura da estrutura \( H \) é 25 m ( \( 20H = 500 m \)).
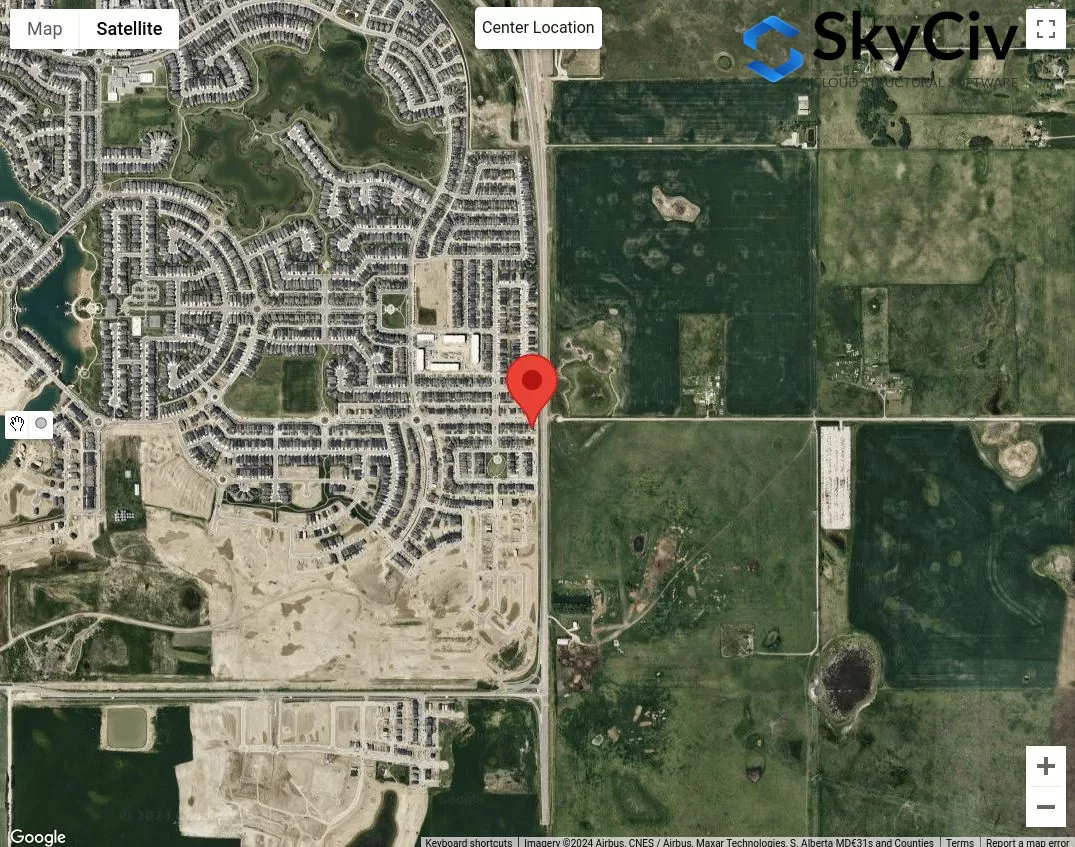
Figura 12. Localização da amostra para análise de categoria de terreno.
O primeiro passo é classificar as categorias óbvias de terreno áspero e aberto para cada direção da fonte do vento. Podemos desenhar 50m e máximo de 1 km ou \( 20 H \) raio do local do site.

Figura 13. Distância deslocada de 50m e 1 km para determinar a categoria de terreno com base na tabela 1 definições.
Da Figura 13, Podemos dizer que as direções da fonte do vento NASCIDO, E, e SE são classificados como Terreno aberto Como o comprimento do terreno acidentado para cada direção é inferior a 50m do local do local. Além disso, Para instruções de fonte de vento W e NW pode ser classificado como terreno acidentado como o comprimento do terreno acidentado para essas direções é maior que 1 km. Para a direção da fonte do vento N, Podemos assumir de forma conservadora que o terreno aberto é dominante nessa direção. Para o resto, S e SW, Podemos concluir que estes são terrenos intermediários e precisaremos medir a distância do terreno acidentado do local do site.
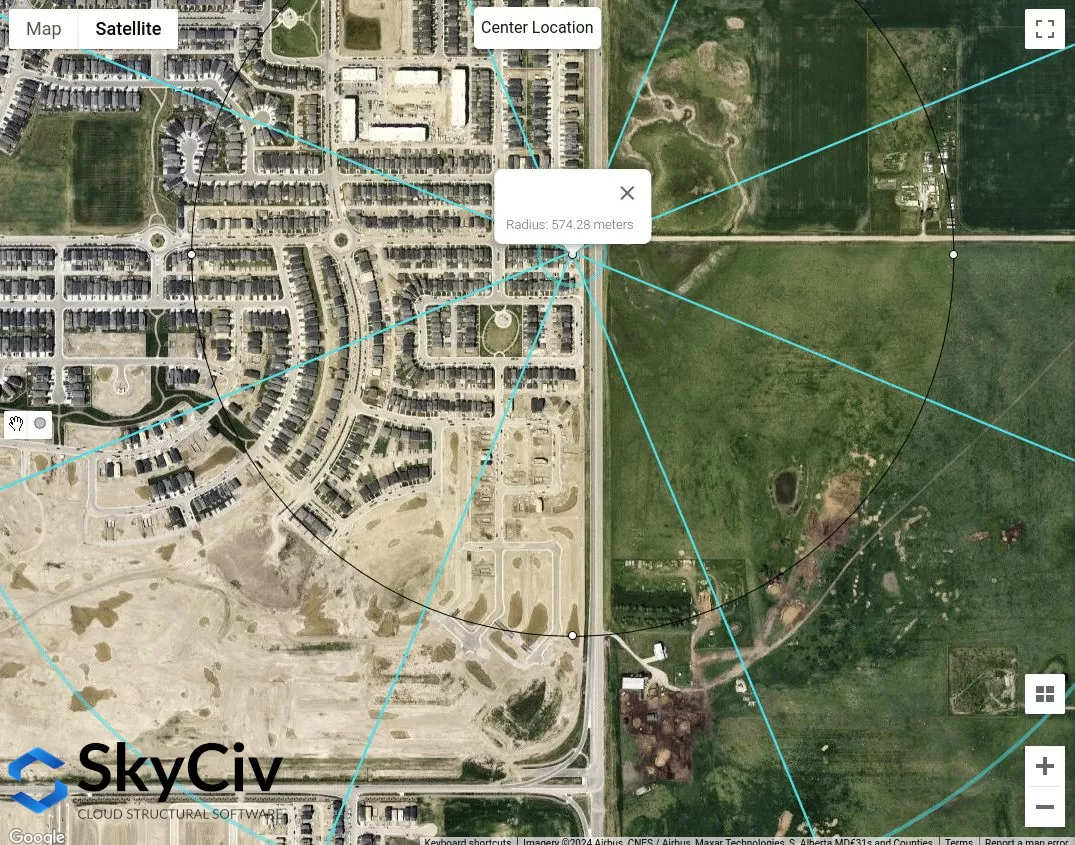
Figura 14. Comprimento aproximado do terreno áspero medido a partir do local do local para a direção da fonte de vento SW igual a 574 m.
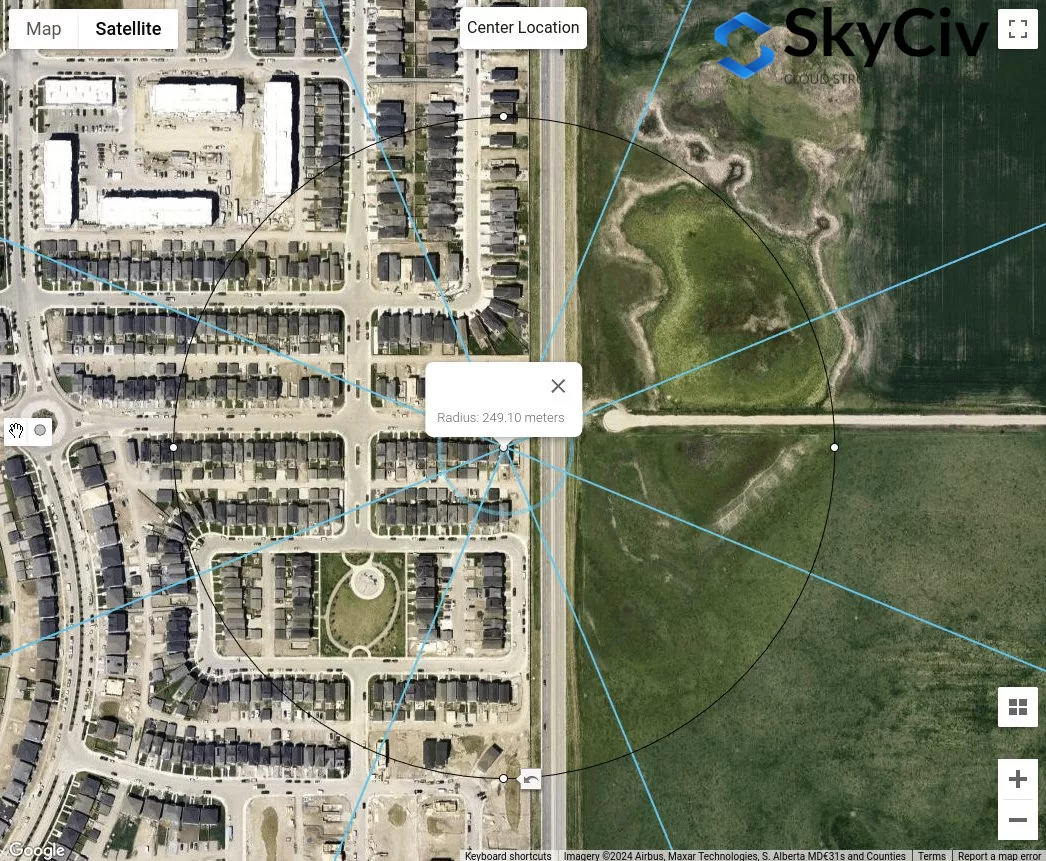
Figura 15. Comprimento aproximado do terreno áspero medido a partir do local do local para a direção da fonte de vento S igual a 249 m.
Da análise acima, Definitivamente, as direções da fonte do vento com terreno aberto definitivamente produzirão os valores conservadores. Contudo, Se todas as instruções da fonte do vento forem classificadas para o terreno intermediário, O procedimento acima é como você pode determinar a categoria de terreno apropriada para cada direção.
AS / NZS 1170.2 (2021)
Para AS/NZS 1170.2, O mesmo procedimento com as referências acima se aplica na determinação da categoria terreno da exposição a favor do vento de um local. Isso é discutido na seção 4.2 de AS / NZS 1170.2 (2021). Para cada direção da fonte do vento, Deve ser analisado a partir de dois setores a favor do vento que se estende ± 45 °. A definição de cada categoria de terreno é mostrada abaixo com base na seção 4.2.1 de AS / NZS 1170.2 (2021):
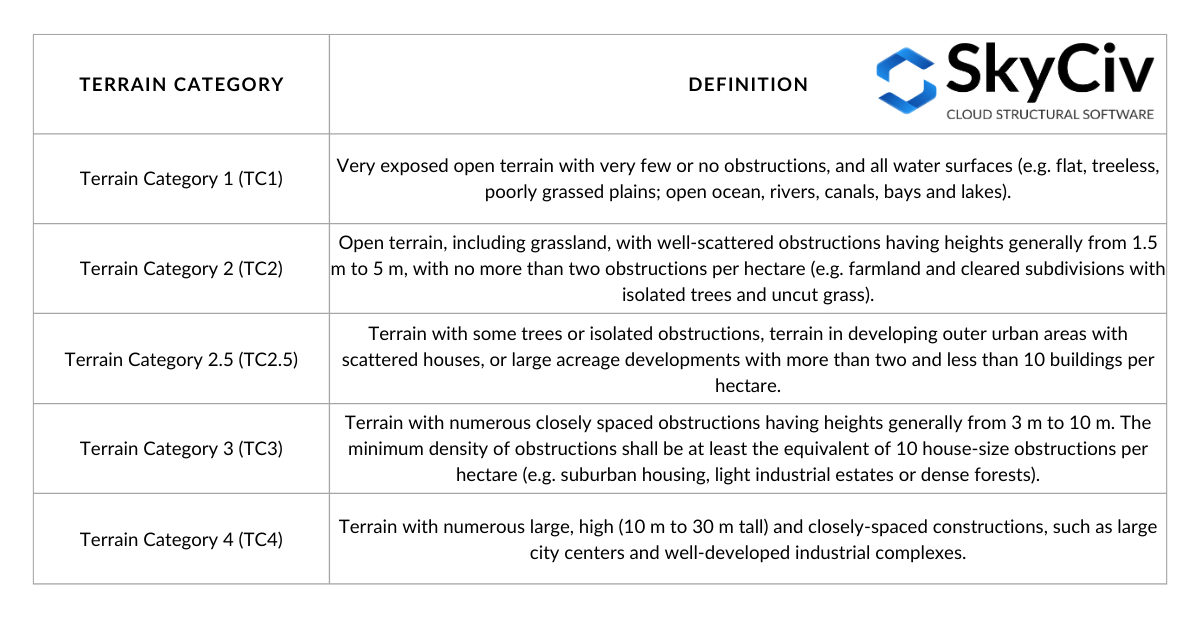
Tabela 4. Definição de categorias de terreno, conforme definido na seção 4.2.1 de AS / NZS 1170.2 (2021).
Ao determinar a categoria de terreno para uma direção, uma distância de atraso igual a \( 20 z \) Do local da estrutura deve ser negligenciado. Deste ponto, uma distância de deslocamento (distância média) de 500 m ou \( 40 [object Window]), o que for maior, deve ser usado como mostrado na figura 16 abaixo. A \( z \) O valor é igual à altura média do telhado, \( h \), Quando é menor ou igual a 25 m. É possível que dentro dessa distância média ter várias categorias de terreno, e como tal, A interpolação linear deve ser usada para determinar o \( M_{z,gato} \) valores, dependendo da duração de cada categoria de terreno, como ilustrado na Figura 4.1 de AS / NZS 1170.2 (2021). Neste artigo, Consideraremos apenas uma categoria de terreno homogêneo dentro da distância média.
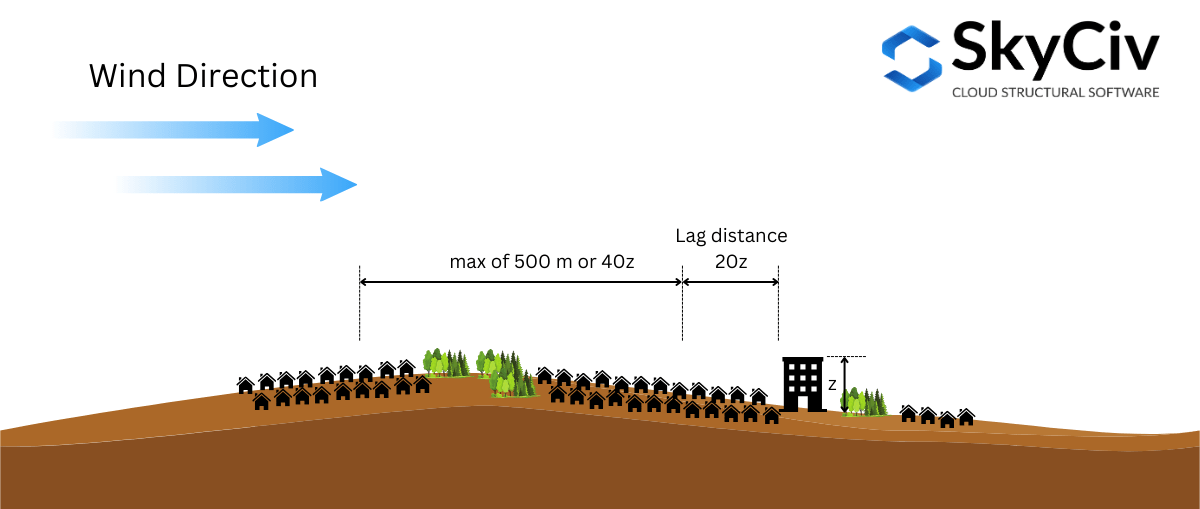
Figura 16. Ilustração das distâncias usadas na determinação da categoria de terreno com base em AS/NZS 1170.2 (2021).
Para ilustrar ainda mais isso, Vamos usar um exemplo de local do site – Lat: 32° 43'46″S lng: 151° 31'47″E – assumindo a altura média do telhado \( h \) é 10 m ( Onde \( 20z = 20h = 200 m \) e \( 40z = 400 m \)).
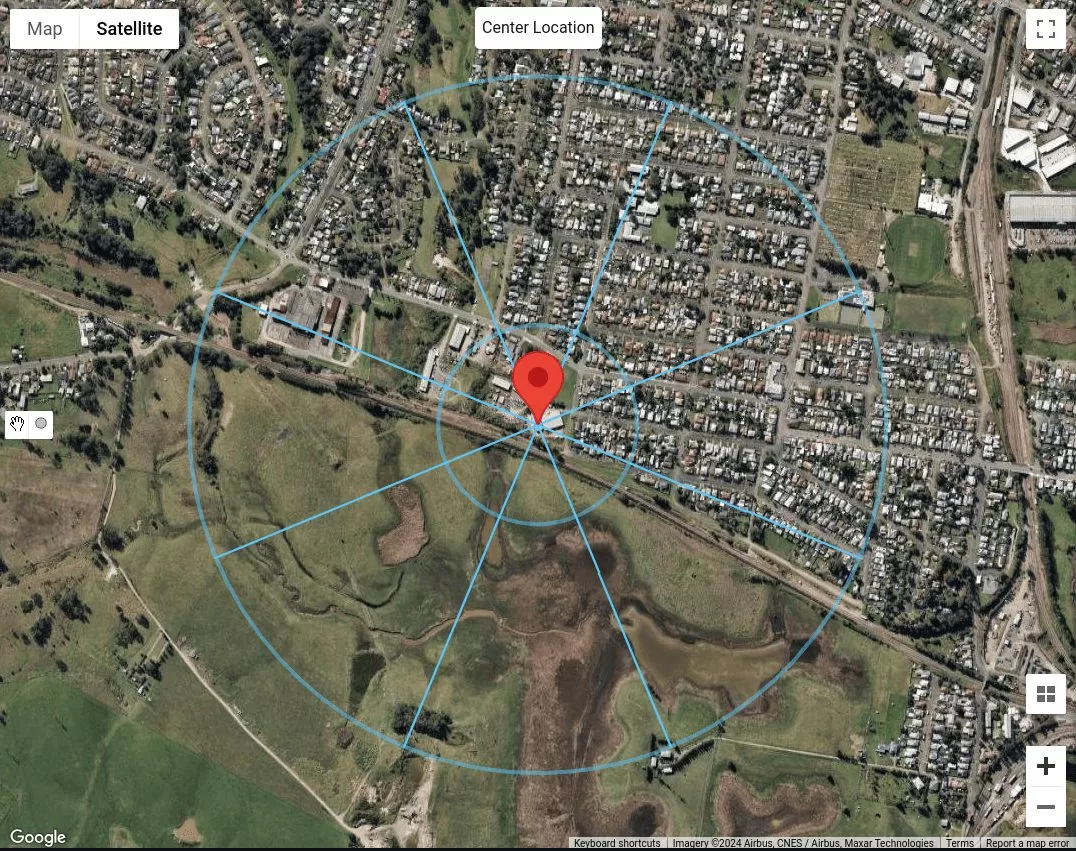
Figura 17. O local do site com distância de atraso igual a 200 m e distância média igual a 500 m para cada direção da fonte do vento.
Como devemos considerar apenas a categoria de terreno como homogênea durante todo o 500m ou \( 40z \) distância, Já podemos classificar cada direção da fonte do vento. Assumindo os edifícios em n, NE e E., são edifícios que são 5 para 10 m de altura, Podemos classificá -los na categoria de terreno 3 (TC3) como mostrado na Tabela 4. Para as instruções da fonte do vento SE, S, Antes de carregar sua estrutura, e w, Como estas são planícies de grama sem obstruções, Podemos classificá -los como categoria de terreno 1 (TC1). Finalmente, Para a direção da fonte do vento NW, Podemos deduzir que existem mais de dois, mas menos do que 10 Edifícios por hectare, com casas dispersas. Portanto, Podemos classificar isso como categoria de terreno 2.5 (TC2.5).
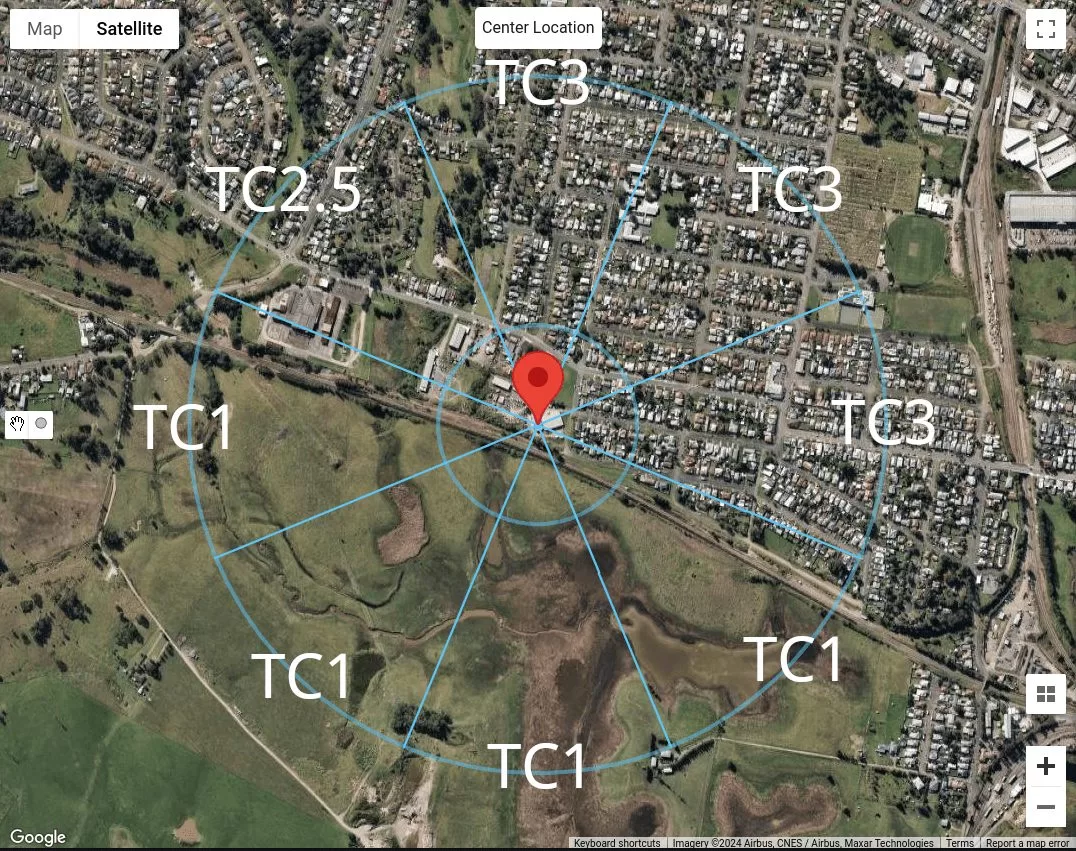
Figura 18. Resumo da classificação da categoria de terreno para cada direção da fonte do vento para o local da nossa amostra.
Usando o gerador de carga SkyCiv
Na versão do gerador de carga Skyciv v4.7.0, Novas ferramentas de mapa são introduzidas – Medir distância e Raios de distância ferramentas.
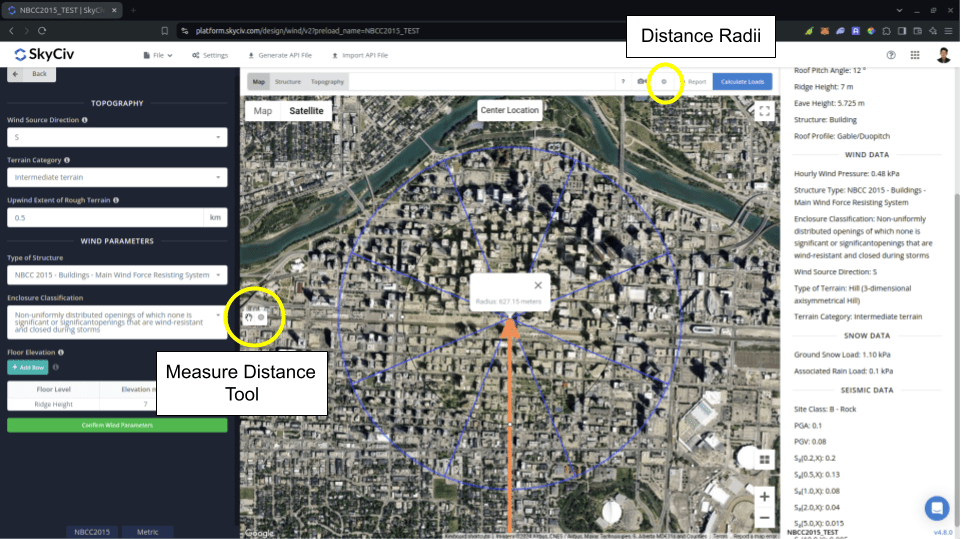
Figura 19. Ferramentas de medição de distância introduzidas no SkyCiv Load Generator.
A Medir distância ferramenta é usada para gerar um círculo a partir de um ponto clicado no mapa e mostrar seu raio em metros. Por aqui, você pode medir as distâncias do local que está sendo analisado em determinados locais. Isso pode ser usado na medição no NBCC 2015 para o Extensão contra o vento do terreno acidentado usado no cálculo Fator de Exposição \( C_{e} \). Clicar no círculo gerado o limpará do mapa.
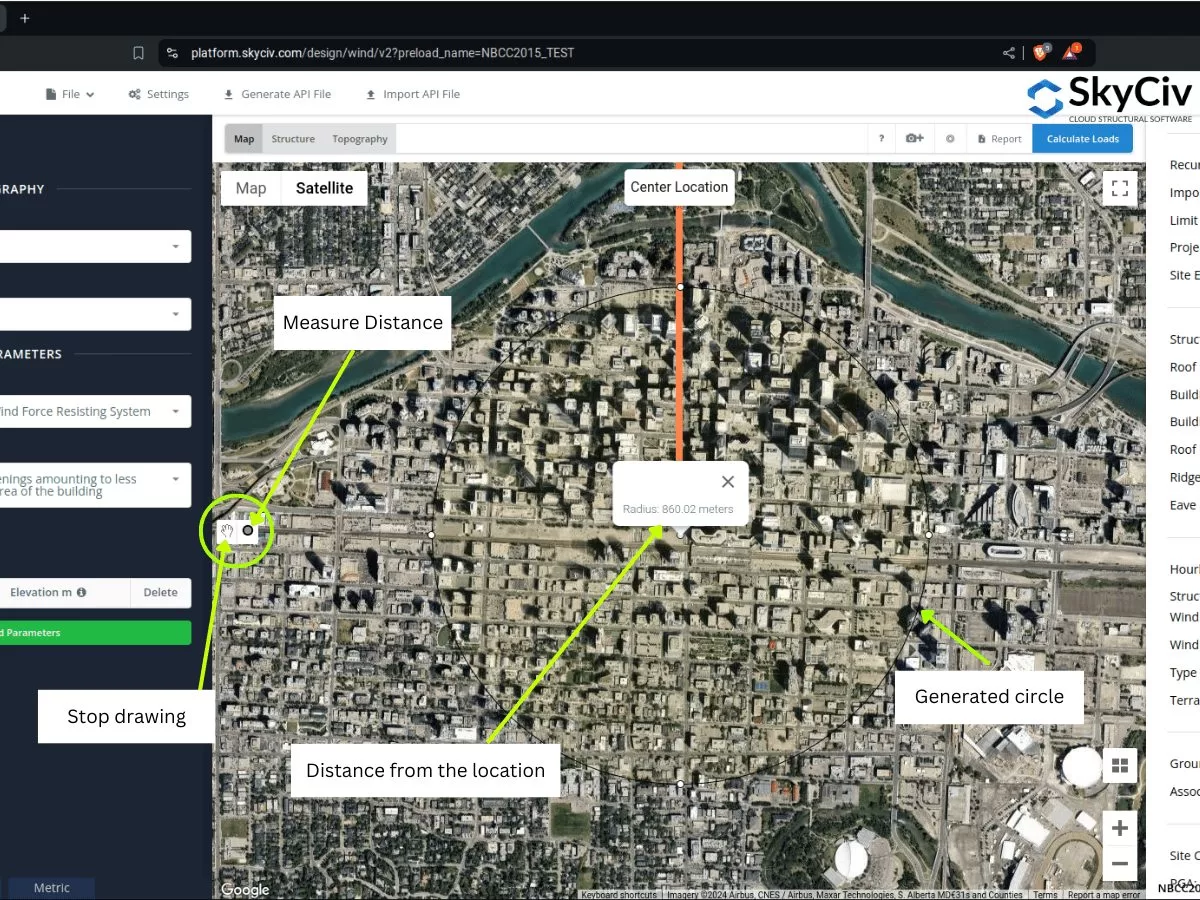
Figura 20. Meça a ferramenta de distância que cria um deslocamento a partir do local e mostrando a distância de raio/deslocamento do centro introduzido ao gerador de carga Skyciv.
Por outro lado, a Raios de distância é introduzido para que os usuários possam desenhar círculos com distâncias específicas do local para cada categoria de fonte de vento. É um botão de alternância para mostrar ou ocultar os raios de distância no mapa, com o local do local como centro dos círculos.
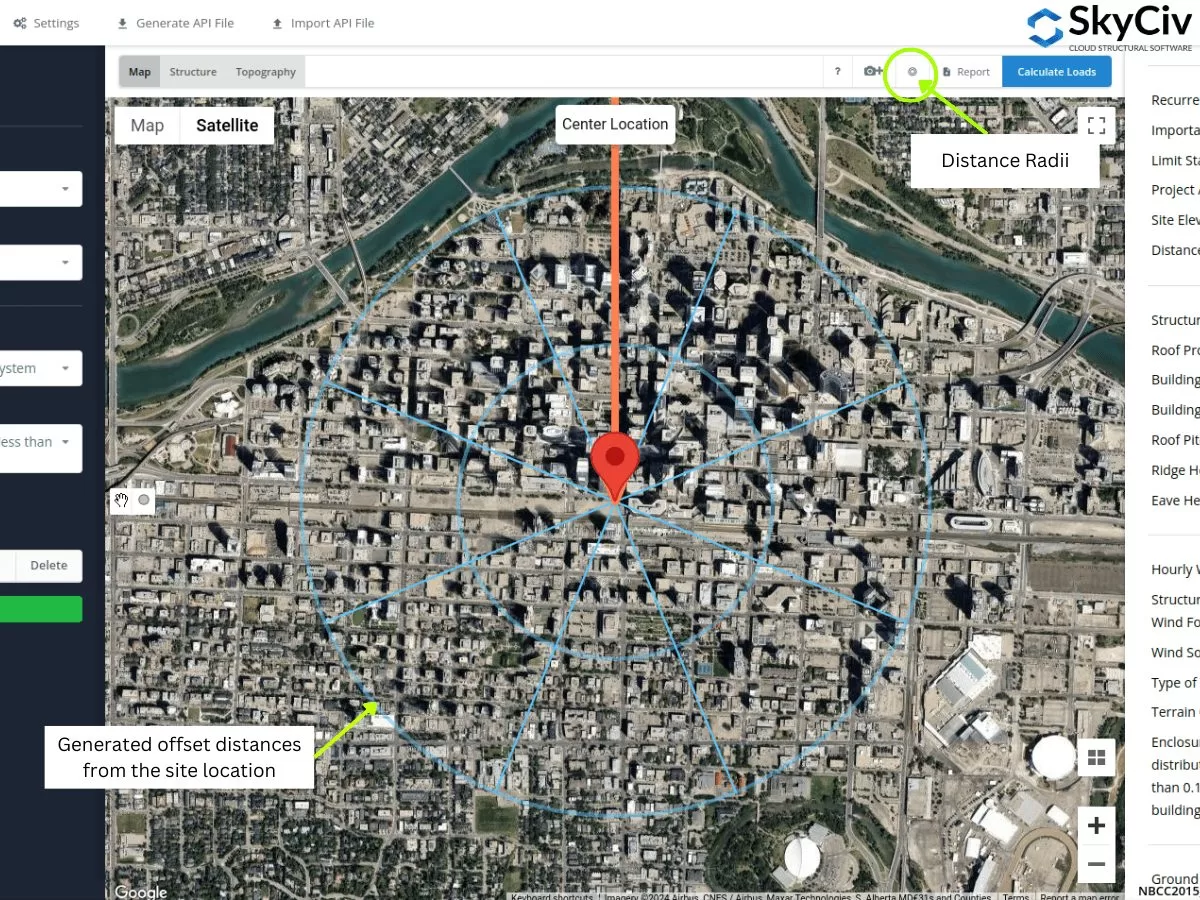
Figura 21. Ferramenta Radii de distância que especificou distâncias de deslocamento do local do local introduzido no gerador de carga Skyciv.
Os valores dos raios podem ser editados após a abertura das configurações.
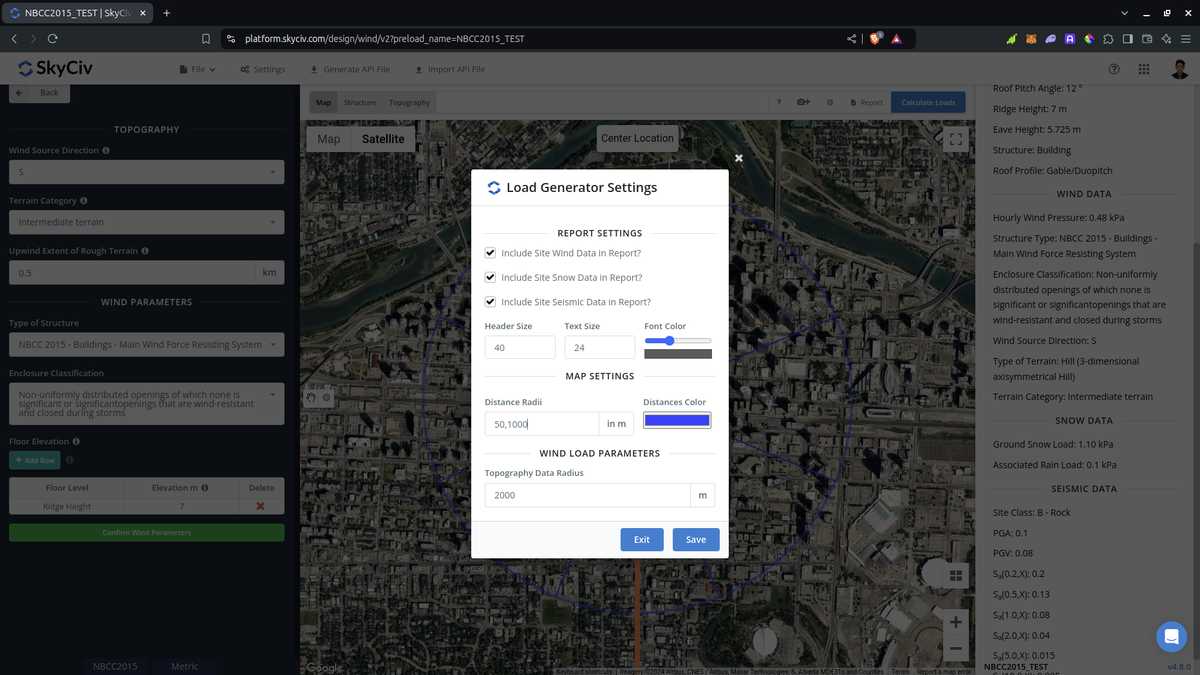
Figura 22. Opção nas configurações para editar as distâncias da ferramenta Distance Radii no SkyCiv Load Generator.
Observe que os usuários devem editar os valores da distância, pois estes não são calculados automaticamente pelo software. Usando isso para ASCE 7 e NBCC, A pior categoria de exposição ou terreno para cada direção da fonte do vento deve ser adotada. No que diz respeito a usá -lo em AS/NZS 1170.2 (2021), O software não usa os valores de raios para calcular para a média \( M_{z,gato} \) valores. Em vez de, A distância média é usada como o intervalo aplicável, onde podemos atribuir uma categoria de terreno homogêneo, Adotando a pior categoria para cada direção da fonte do vento.
Das seções discutidas acima, Você pode usar essas novas ferramentas para determinar as categorias de exposição ou terreno para cada fonte de fonte de vento. Os procedimentos acima podem fornecer uma classificação rápida do terreno de cada direção da fonte do vento. Usando ferramentas GIS e AI, Você pode verificar ainda mais os critérios que usamos acima para cada direção da fonte do vento e pode obter um resultado melhor e eficiente.
Engenheiro estrutural, Desenvolvimento de Produto
MS Engenharia Civil
Referências:
- Cargas mínimas de projeto para edifícios e outras estruturas. (2017). EIXOS / SEIS 7-16. Sociedade Americana de Engenheiros Civis.
- Conselho Nacional de Pesquisa do Canadá. (2015). Código Nacional de Construção do Canadá, 2015. Conselho Nacional de Pesquisa do Canadá.
- Padrões da Austrália (2021), Ações de projeto estrutural. Papel 2 Ações do vento, Padrão australiano/Nova Zelândia AS/NZS1170.2:2021, Padrões da Austrália, Sydney, NSW, Austrália.
- Google Maps


