In dit artikel, We zullen u door de categorieën van het terrein of de belichting van de tegenwindzijde van de locatie van de site bepalen., die essentieel zijn voor het berekenen van windbelastingen. We dekken de specifieke procedures die zijn beschreven in ASCE 7, NBCC 2015, en AS/NZS 1170.2 Voor het bepalen van de terreincategorieën en bespreken hoe deze van toepassing zijn op elke referentiecode die beschikbaar is in de SkyCiv Load Generator.
ASCE 7-16/ASCE 7-22
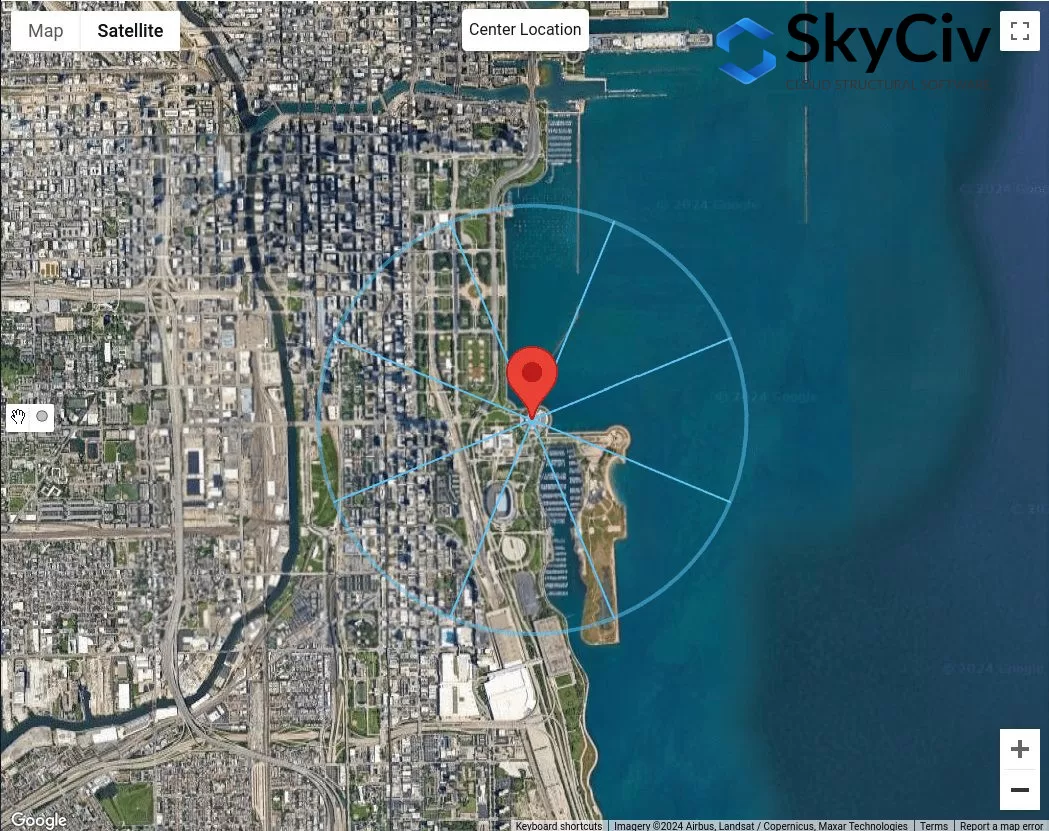
we zullen de effecten van topografie op windbelasting op constructies bespreken door de topografische factor te berekenen 7, De procedure om de blootstellingscategorie van de blootstelling aan de wind van een locatielocatie te bepalen, wordt in sectie besproken 26.7, Afhankelijk van het terrein. In dit artikel, Om de referentie te vereenvoudigen, We zullen asce gebruiken 7-16. Voor elke windbronrichting, Het moet worden geanalyseerd uit twee tegenwind sectoren die ± 45 ° uitbreiden.
Figuur 1. Terreinsectoren voor elke richting van de windbron.
Voor elke sector, De categorie oppervlakteruwheid moet worden gecontroleerd op basis van de volgende definitie op basis van sectie 26.7.2 van ASCE 7-16:
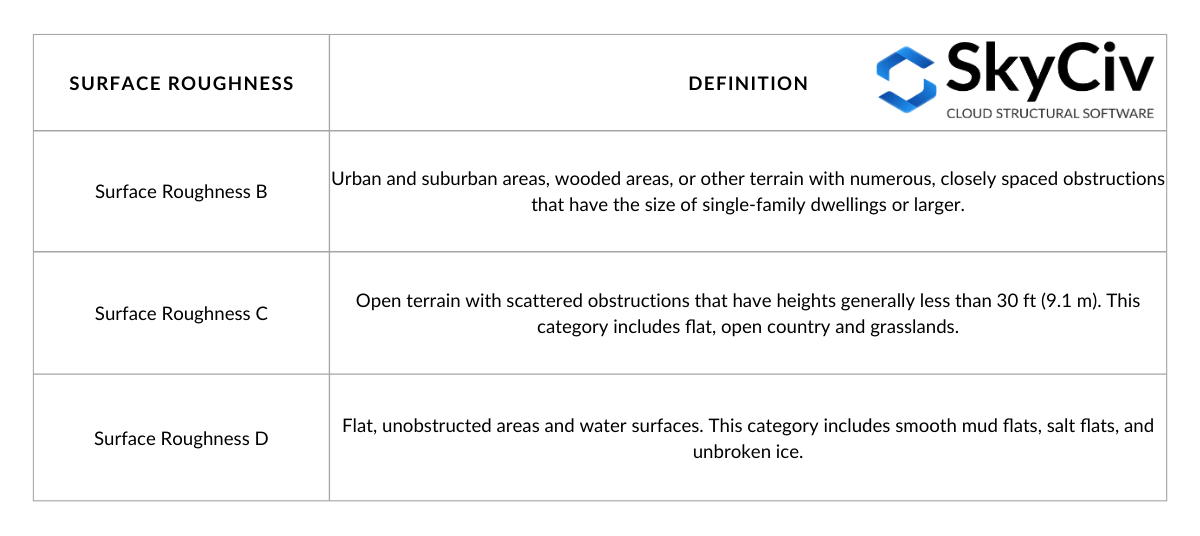
Tafel 1. Definitie van de oppervlakte -ruwheid op basis van sectie 26.7.2 van ASCE 7-16.
Uit de definitie van oppervlakteruwheid, We kunnen de blootstellingscategorie van het terrein begrensd door de tegenwind sector bepalen. De definitie voor elke belichtingscategorie wordt in sectie vermeld 26.7.3 van ASCE 7-16 als volgt:
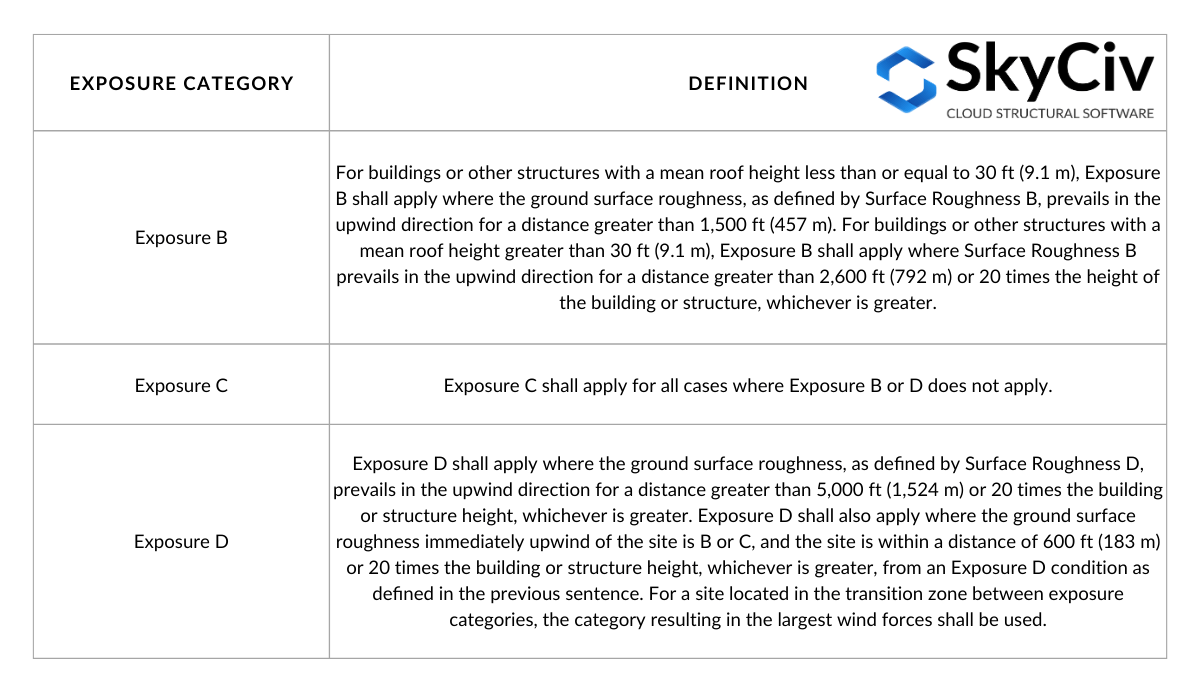
Tafel 2. Blootstellingscategorie Definitie op basis van sectie 26.7.3 van ASCE 7-16.
De tafel 2 kan worden gevisualiseerd door de volgende cijfers op basis van figuur C26.7-2:
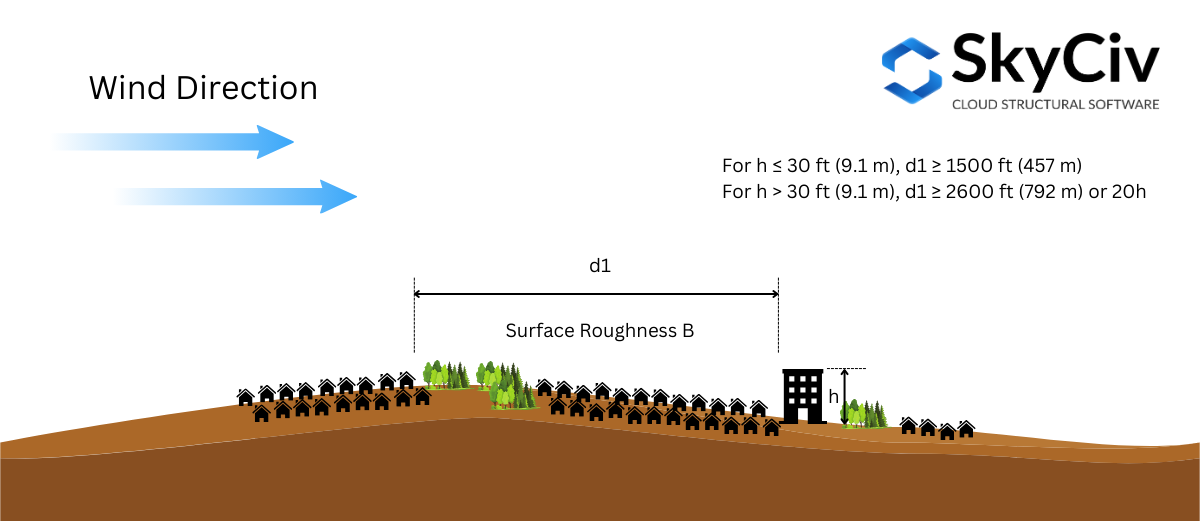
Figuur 2. Ruwheid van het oppervlak van de windopwind vereist voor blootstelling B.
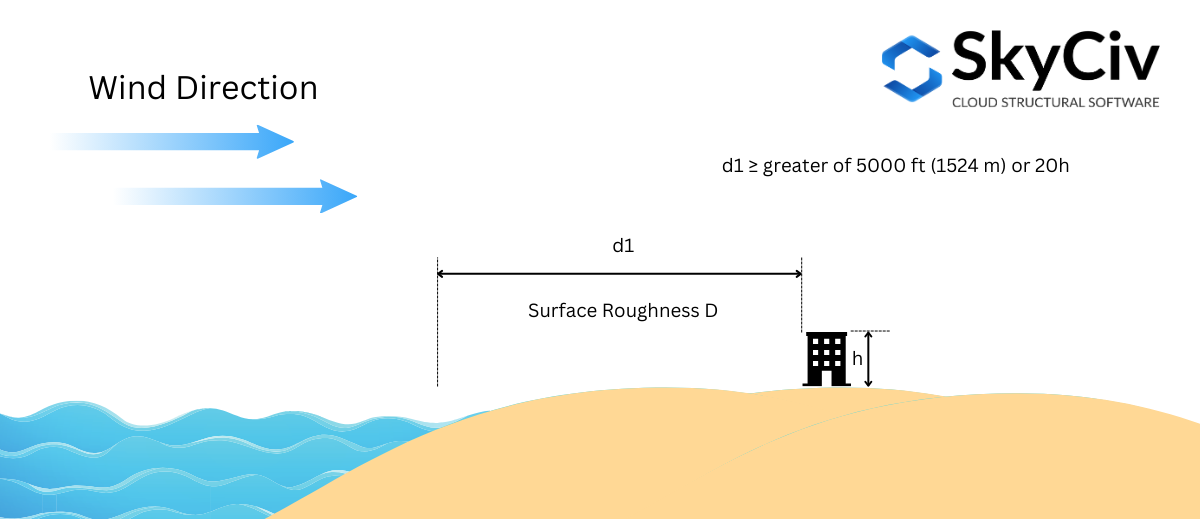
Figuur 3. Opwind oppervlakte ruwheid conditie vereist voor blootstelling D – geval 1.
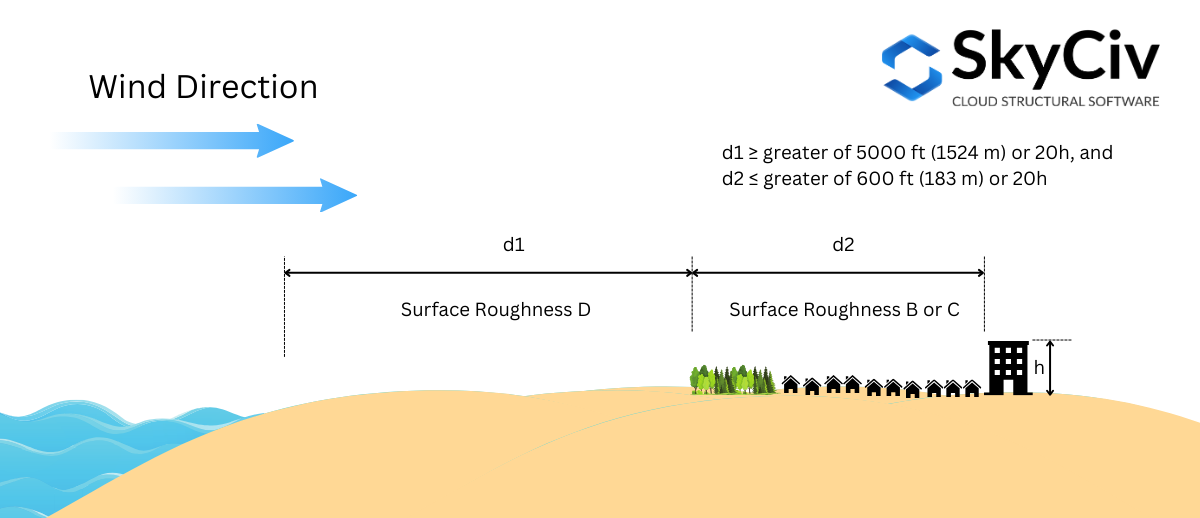
Figuur 4. Opwind oppervlakte ruwheid conditie vereist voor blootstelling D – geval 2.
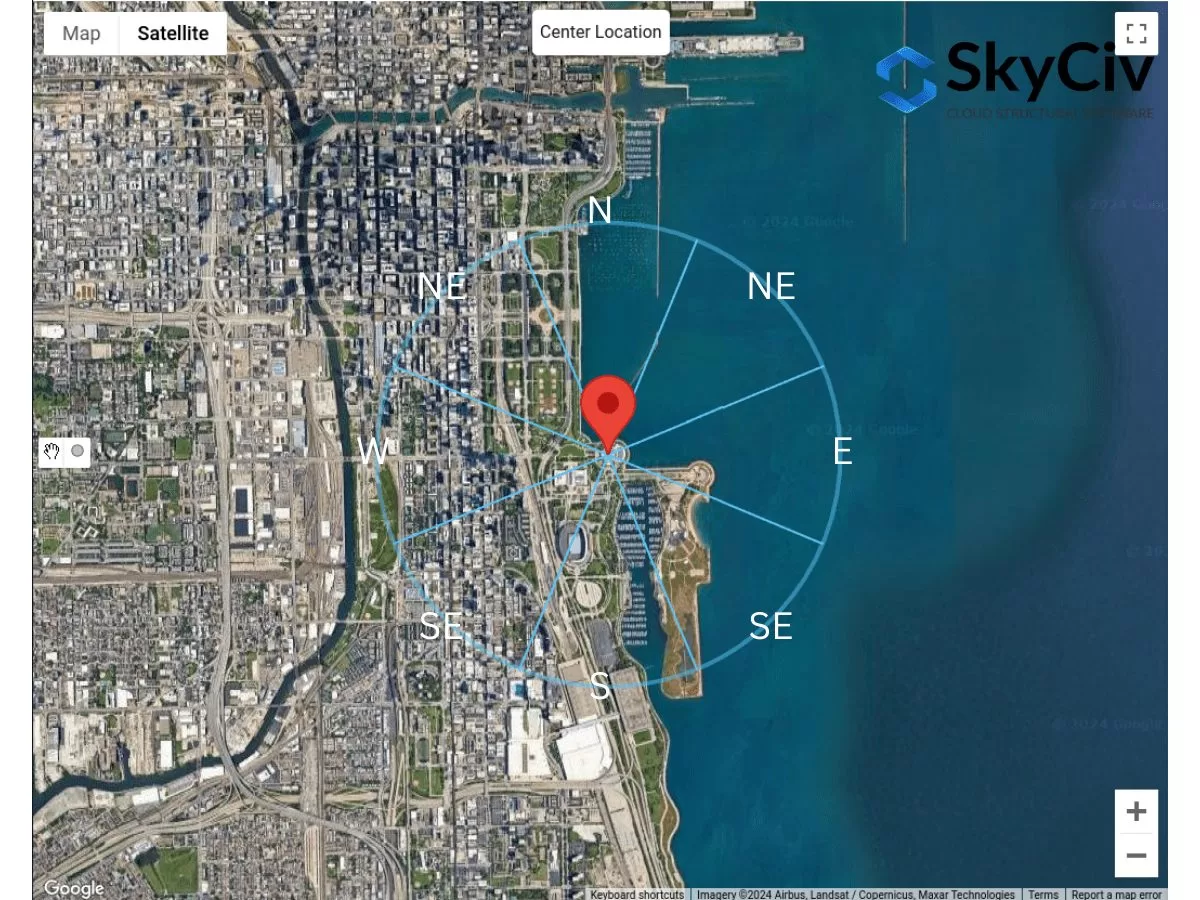
De blootstellingscategorie moet worden bepaald voor elke richting van de windbron. Een voorbeeldlocatie gebruiken – “1200 S DUSABLE LAKE SHORE DR, Chicago, DE 60605, VS”, Laten we dit voor elke richting analyseren.
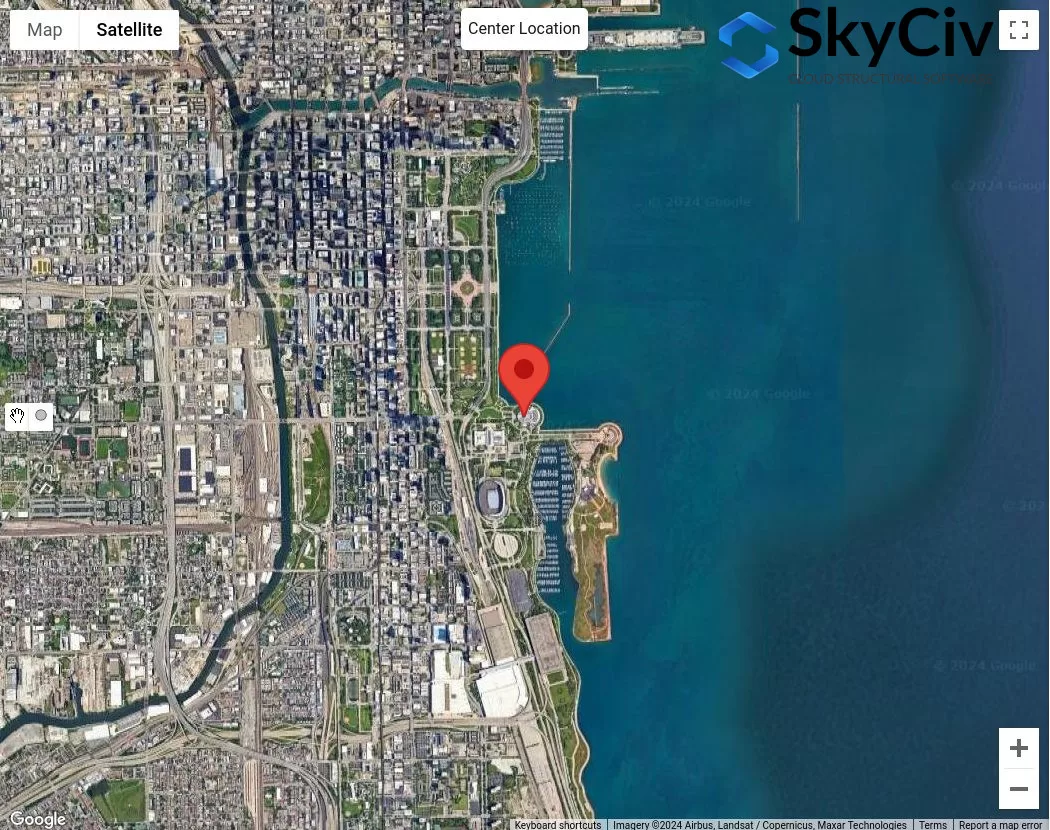
Figuur 4. Monsterlocatie voor exposure categorie analyse.
Ervan uitgaande dat de gemiddelde dakhoogte van de structuur is 25 ft ( \( 20h = 500 ft \)), We zullen de volgende procedure gebruiken om de belichtingscategorie voor elke sector te controleren:
Voorwaarde 1. Bepaal of blootstelling D met behulp van figuur 3:
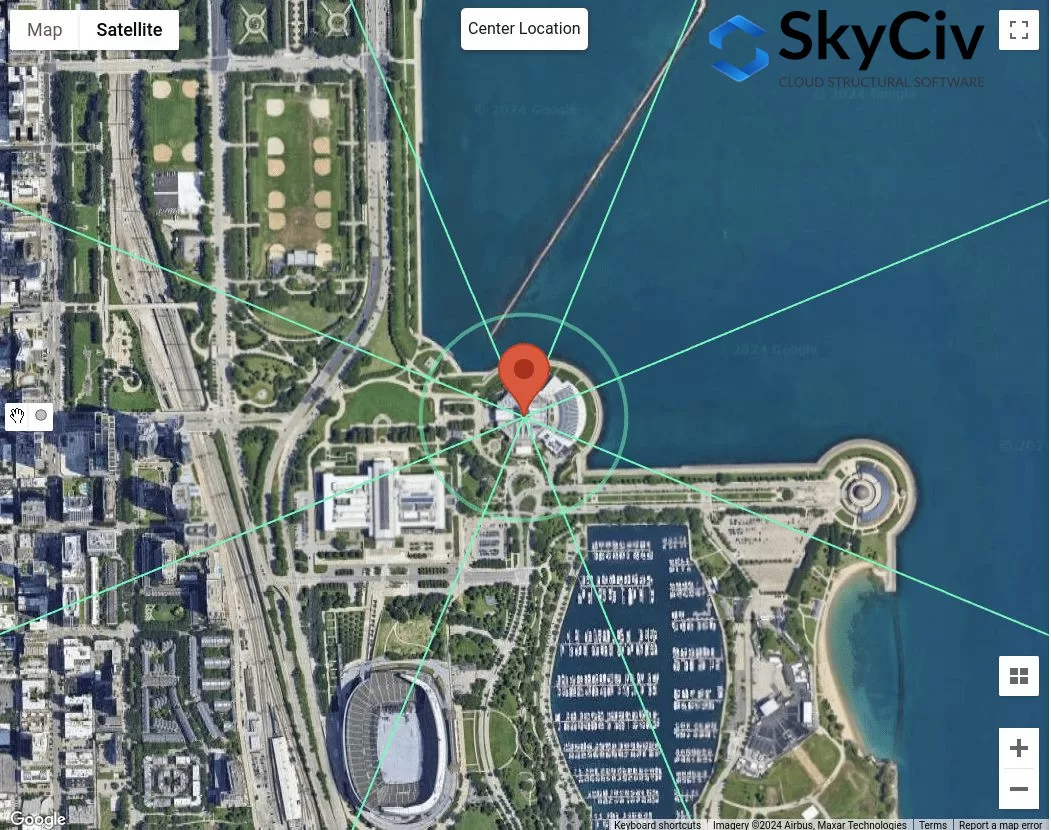
Figuur gebruiken 3 – Waar de afstand \( d_{1} \) is 5000 ft (1524 m), We moeten controleren op belichting D, waar oppervlakteruwheid D dominant is voor het geheel 5000 ft stretch:
Figuur 5. Afstand van de afstand van 5000 ft vanaf de locatie locatie voor belichting D Controleer met behulp van figuur 3.
Van figuur 5, We kunnen al concluderen dat de aanwijzingen van windbron N, GEBOREN, en E hebben oppervlakteruwheid D voor het geheel 5000 ft stretch. Daarom, Deze aanwijzingen voor windbron zijn Blootstelling D.
Voorwaarde 2. Bepaal of blootstelling D met behulp van figuur 2
Figuur gebruiken 4 – Waar de afstand \( d_{1} \) is 5000 ft (1524 m) en afstand \( d_{2} \) is gelijk aan 600 ft (183 m), We moeten controleren op belichting D. Van figuur 5, Dit kan alleen worden toegepast voor windbronrichting van SE:
Figuur 6. Offset afstand van 600 ft en extra 5000 ft vanaf de locatie locatie voor belichting D Controleer met behulp van figuur 4.
Voor windbronrichting SE, gebruik makend van \( d_{2} = 600 ft \), We kunnen bedenken dat deze sectie oppervlakte -ruwheid B is. Echter, voor afstand \( d_{1} = 5000 ft \), De sectie is dat niet 100% Oppervlakteruwheid D. Vandaar, SE moet niet worden beschouwd als blootstelling D.
Voorwaarde 3. Bepaal of blootstelling B met figuur 1
Figuur gebruiken 3 – Waar de afstand \( d_{1} \) is 1500 ft (457 m) sinds \( h < 30 ft \), We moeten controleren op blootstelling B.
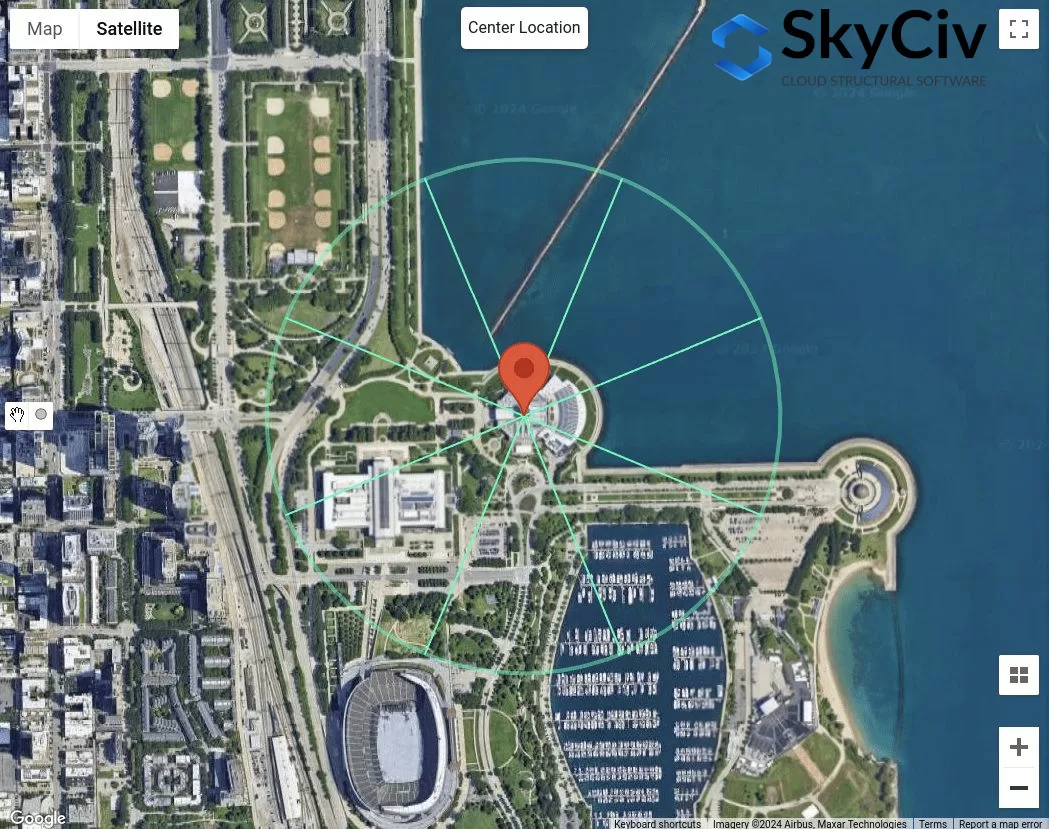
Figuur 7. Afstand van de afstand van 1500 ft vanaf de locatie locatie voor belichting B Controleer met behulp van figuur 3.
Van figuur 7, We kunnen bepalen dat voor windbronrichtingen NW, W, SW, en s worden geclassificeerd als blootstelling B als de oppervlakteruwheid voor elke richtingsector is oppervlakteruwheid B.
Voorwaarde 4. Als voorwaarden 1 naar 3 zijn niet waar, daarom, Het terrein is blootstelling C.
Daarom, Voor windbronrichting SE, het is geclassificeerd als belichtingscategorie C. samengevat, De belichtingscategorieën voor elke windbronrichting worden weergegeven in figuur 8 hieronder.
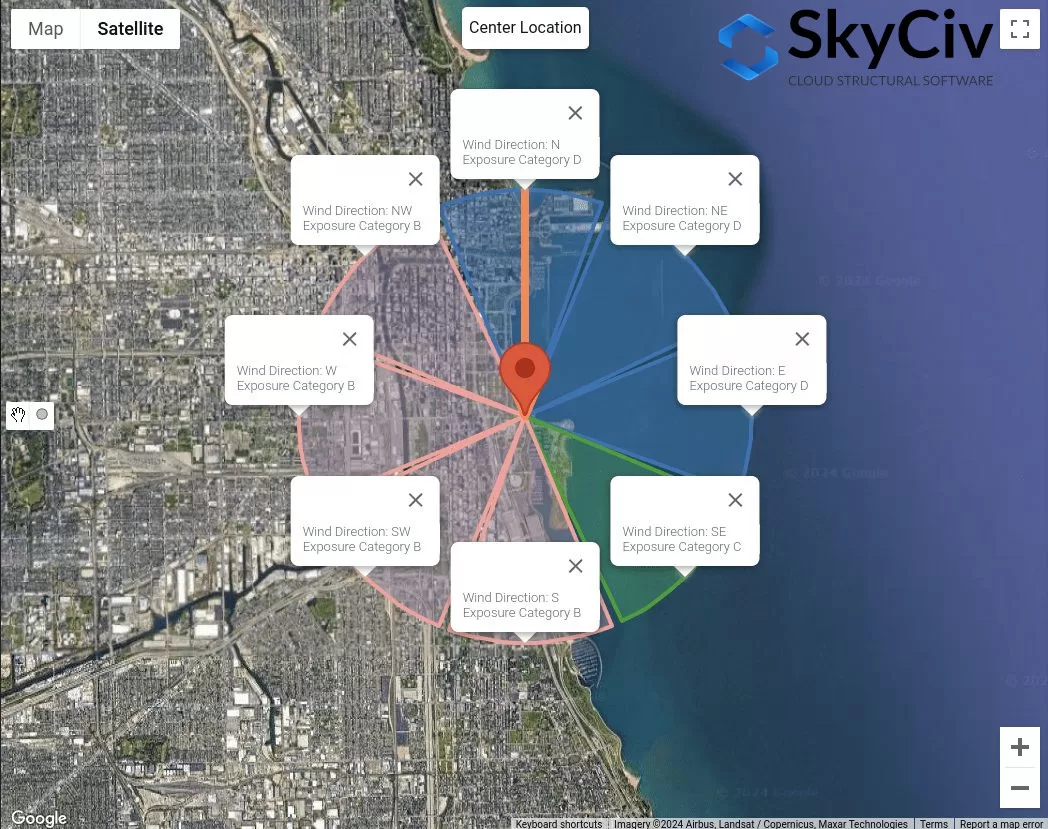
Figuur 8. De belichtingscategorieën voor elke richting van de windbron.
Deze gegevens kunnen worden gebruikt om te bepalen wat de slechtste windbronrichting zal zijn als de snelheidsdrukcoëfficiënten \( Hieronder volgen de verschillende manieren om de gronddrukcoëfficiënten te bepalen om de eenheidswrijvingsweerstand van palen in zand te berekenen{z} \), Topografische factor \( Hieronder volgen de verschillende manieren om de gronddrukcoëfficiënten te bepalen om de eenheidswrijvingsweerstand van palen in zand te berekenen{t} \), en windvlagenfactor \( G \) Het gebruik van gedetailleerde berekening wordt beïnvloed door de blootstellingscategorie.
NBCC 2015/2020
Voor NBCC 2015, De procedure om de blootstellingscategorie van de blootstelling aan de wind van een locatielocatie te bepalen, wordt in sectie besproken 4.1.7.3(5), Afhankelijk van het terrein. Voor elke windbronrichting, Het moet worden geanalyseerd uit twee tegenwind sectoren die ± 45 ° uitbreiden.
Figuur 9. Terreinsectoren voor elke richting van de windbron.
Voor elke sector, De categorie terrein moet worden gecontroleerd op basis van de volgende definitie op basis van sectie 4.1.7.3(5) van NBCC 2015:
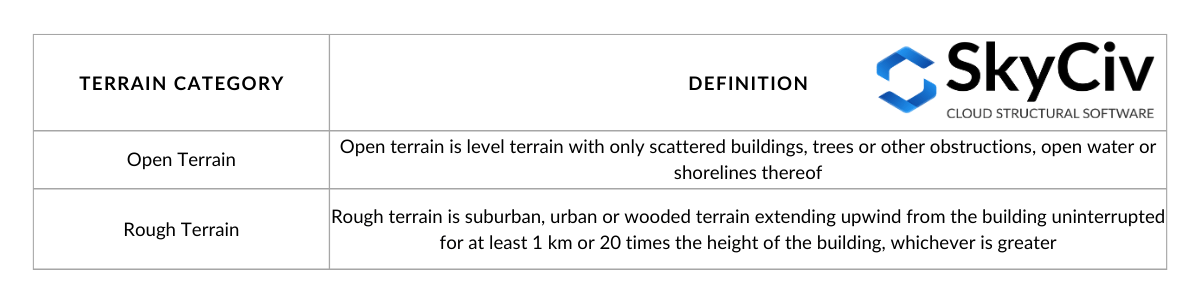
Tafel 3. Definitie van terreincategorieën zoals gedefinieerd in sectie 4.1.7.3(5) van NBCC 2015.
Visualiseren van de opties in tabel 3:
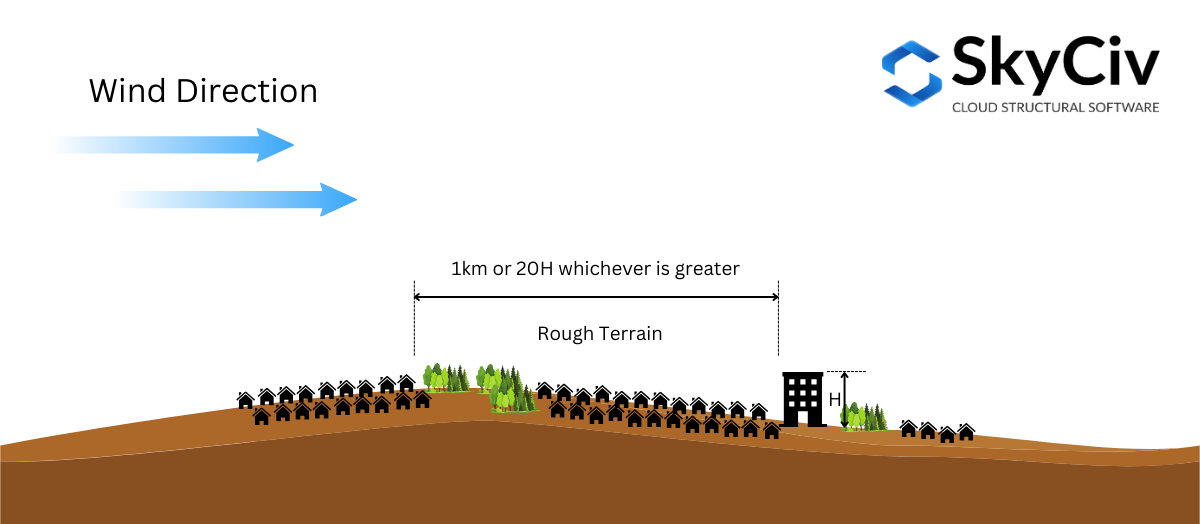
Figuur 10. Definitie van ruw terrein zoals gedefinieerd in sectie 4.1.7.3(5) van NBCC 2015.
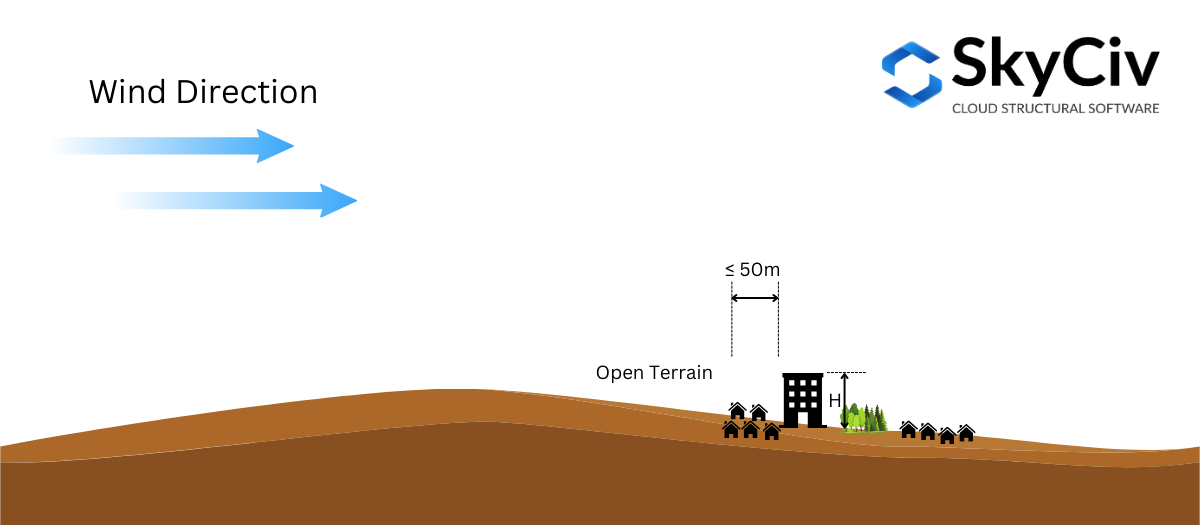
Figuur 10. Definitie van open terrein zoals gedefinieerd in sectie 4.1.7.3(5) van NBCC 2015.
Gebaseerd op sectie 4.1.7.3(5) van NBCC 2015, het is toegestaan om de Blootstellingsfactor \( C_{e} \) op tussenliggende terrein. Als de ruwe terreinafstand van de structuurlocatie groter is dan of gelijk is aan 1 km of 20 maal de hoogte van de constructie, welke groter is, het terrein kan worden beschouwd als Ruw terrein, en als de afstand kleiner is dan 50 m, het wordt beschouwd als Open terrein. Anders, de belichtingsfactor \( C_{e} \) volgens Sectie 4.1.7.3(5) wordt berekend uit de grenswaarden. Dit kan in figuur worden gevisualiseerd 11 hieronder.
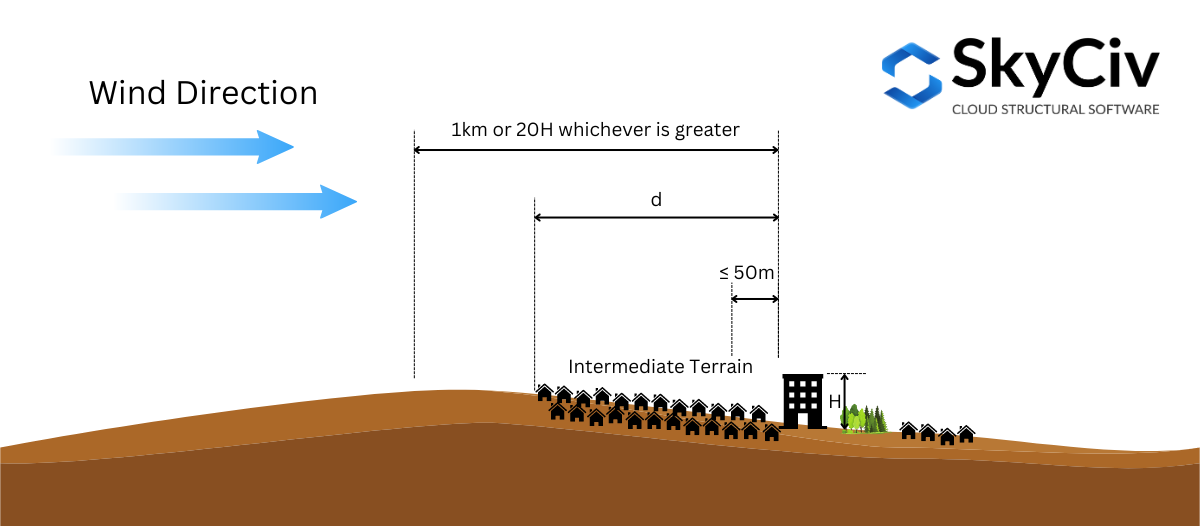
Figuur 11. Definitie van tussenliggende terrein zoals gedefinieerd in sectie 4.1.7.3(5) van NBCC 2015.
Om dit verder te illustreren, Laten we een voorbeeldlocatie gebruiken – “657 Masters Rd SE, Calgary, AB T3M 2B6, Canada,” Uitgaande van de structuurhoogte \( H. \) is 25 m ( \( 20H = 500 m \)).
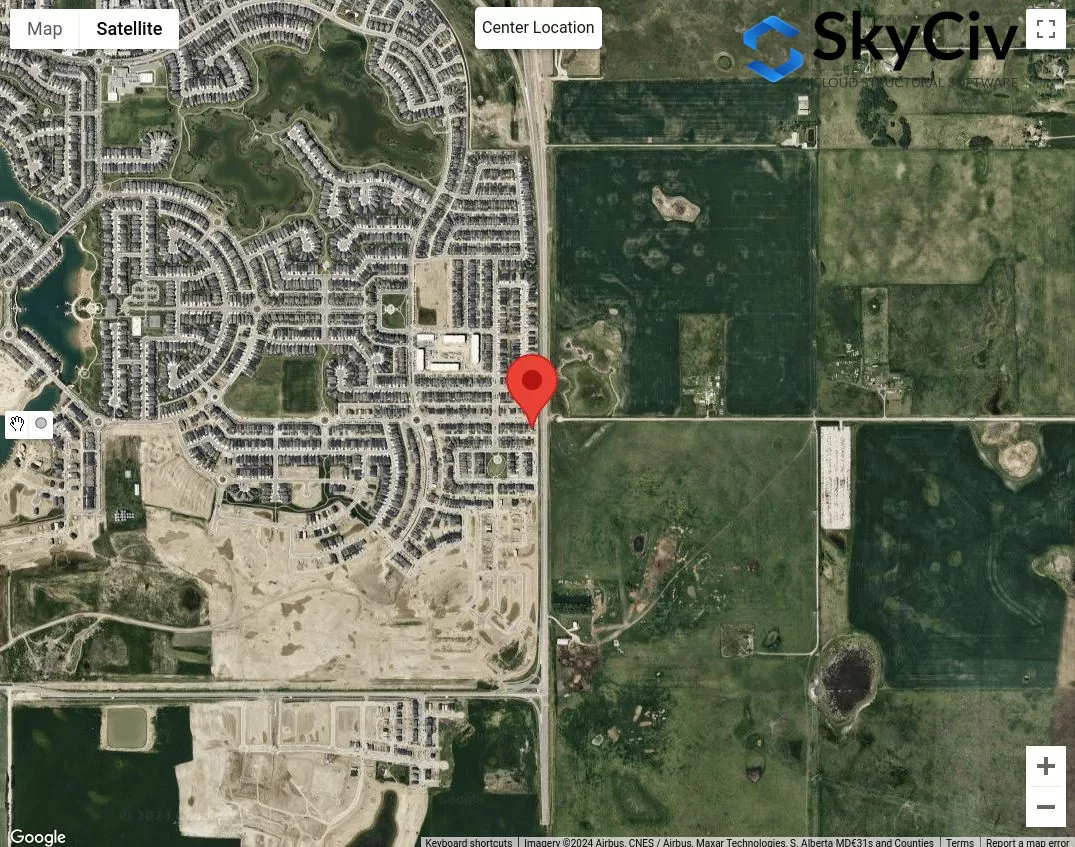
Figuur 12. Voorbeeldlocatie voor analyse van terreincategorie.
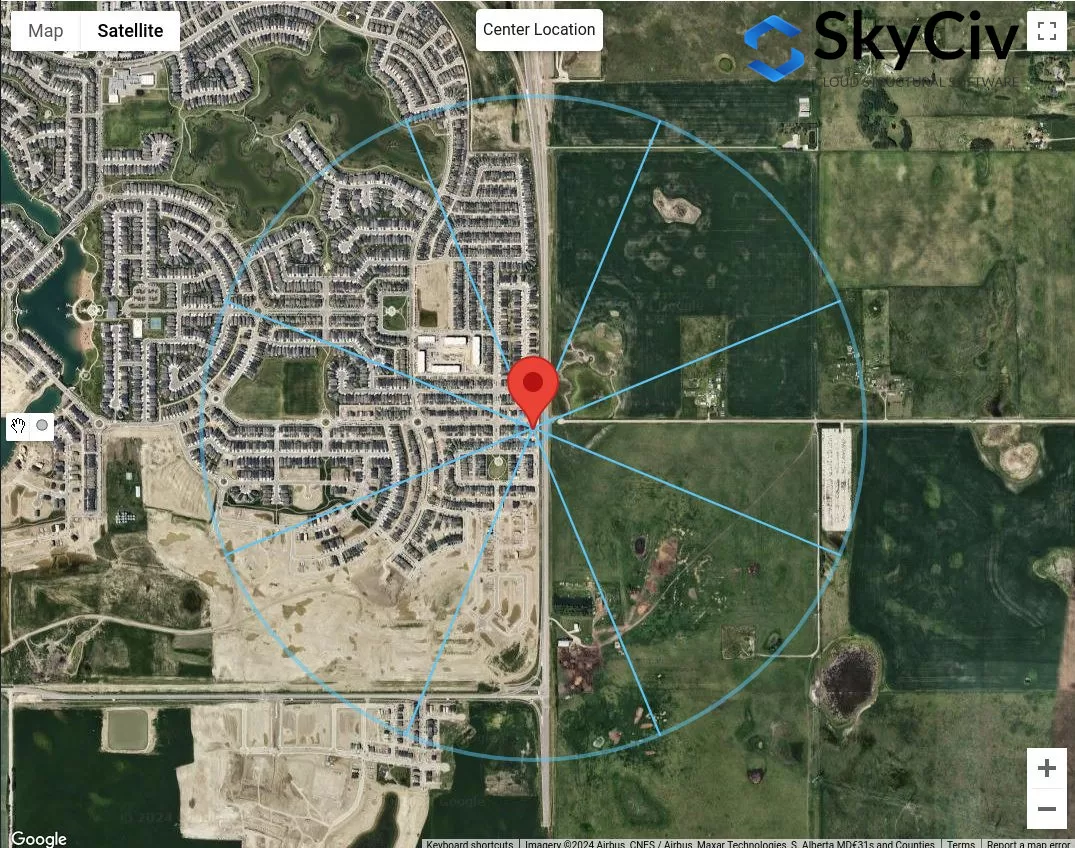
De eerste stap is het classificeren van de voor de hand liggende ruwe en open terreincategorieën voor elke windbronrichting. We kunnen 50 m en max van tekenen 1 km of \( 20 H. \) straal van de locatie locatie.
Figuur 13. Offset afstand van 50 m en 1 km voor het bepalen van de terreincategorie op basis van de tabel 1 definities.
Van figuur 13, We kunnen zeggen dat de aanwijzingen van de windbron GEBOREN, E, en SE zijn geclassificeerd als Open terrein Omdat de ruwe terreinlengte voor elke richting op minder dan 50 meter van de locatie ligt. Bovendien, Voor aanwijzingen van windbron W en NW kan worden geclassificeerd als ruw terrein omdat de ruwe terreinlengte voor deze richtingen groter is dan 1 km. Voor windbronrichting N, We kunnen conservatief aannemen dat het open terrein dominant is in deze richting. Voor de rest, S en SW, We kunnen concluderen dat dit een tussenliggend terrein is en we zullen de afstand van het ruwe terrein van de locatie moeten meten.
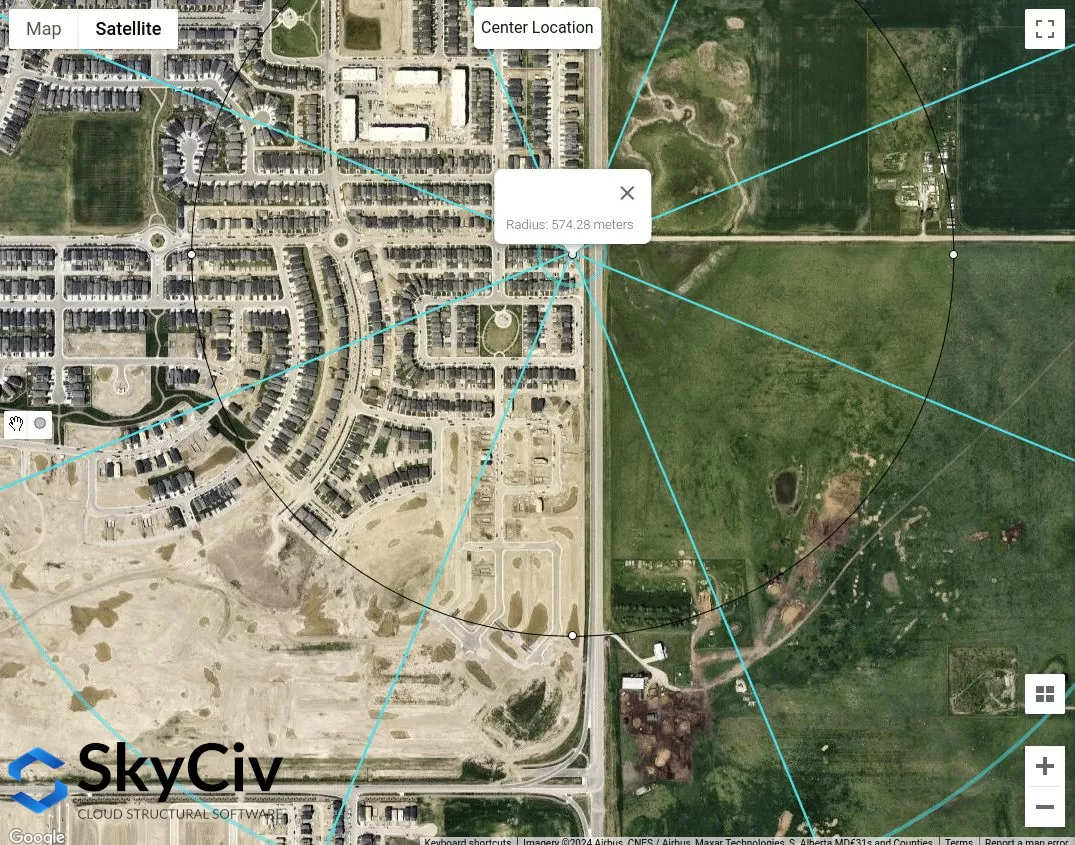
Figuur 14. Geschatte ruwe terreinlengte gemeten vanaf locatie locatie voor SW -windbronrichting gelijk aan 574 m.
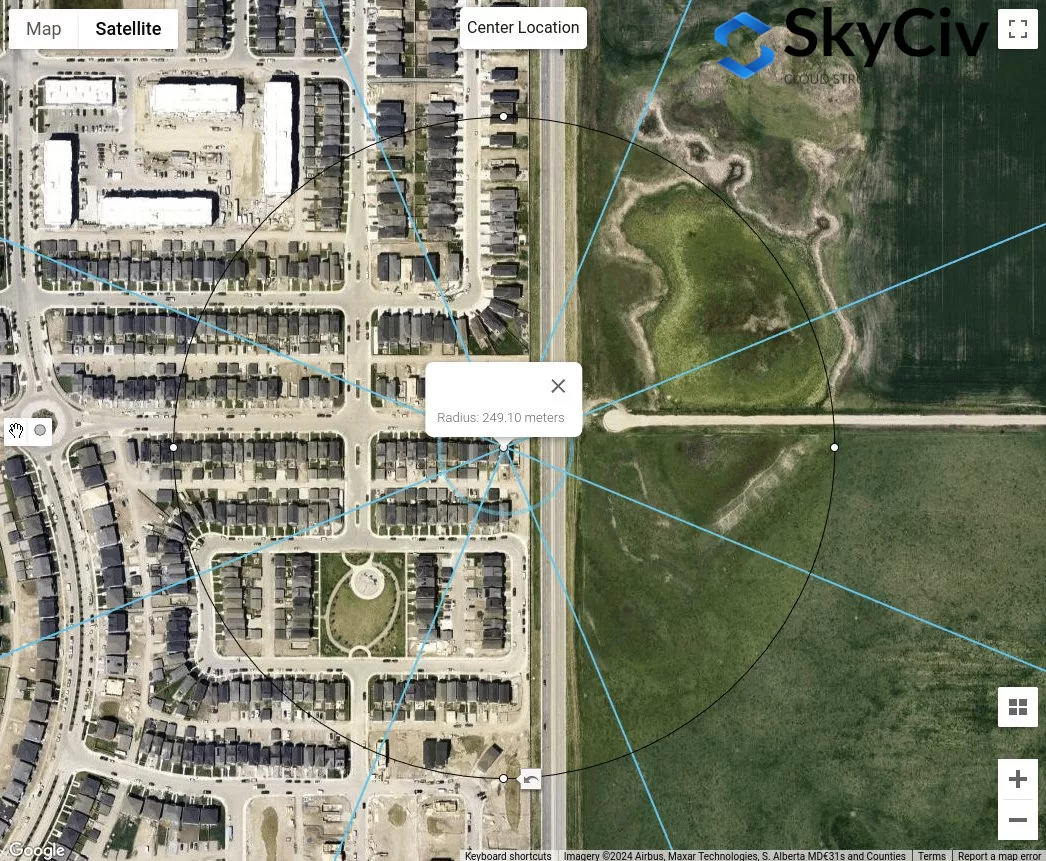
Figuur 15. Geschatte ruwe terreinlengte gemeten vanaf locatie locatie voor s windbronrichting gelijk aan 249 m.
Uit de bovenstaande analyse, Absoluut de aanwijzingen van de windbron met open terrein zullen zeker de conservatieve waarden opleveren. Echter, Als alle aanwijzingen van de windbron worden geclassificeerd naar tussenliggende terrein, De bovenstaande procedure is hoe u de juiste terreincategorie voor elke richting kunt bepalen.
AS / NZS 1170.2 (2021)
Voor AS / NZS 1170.2, Dezelfde procedure met de bovenstaande referenties is van toepassing bij het bepalen van de terreincategorie van de blootstelling aan de wind van een site -locatie. Dit wordt in sectie besproken 4.2 van AS / NZS 1170.2 (2021). Voor elke windbronrichting, Het moet worden geanalyseerd uit twee tegenwind sectoren die ± 45 ° uitbreiden. De definitie van elke terreincategorie wordt hieronder weergegeven op basis van sectie 4.2.1 van AS / NZS 1170.2 (2021):
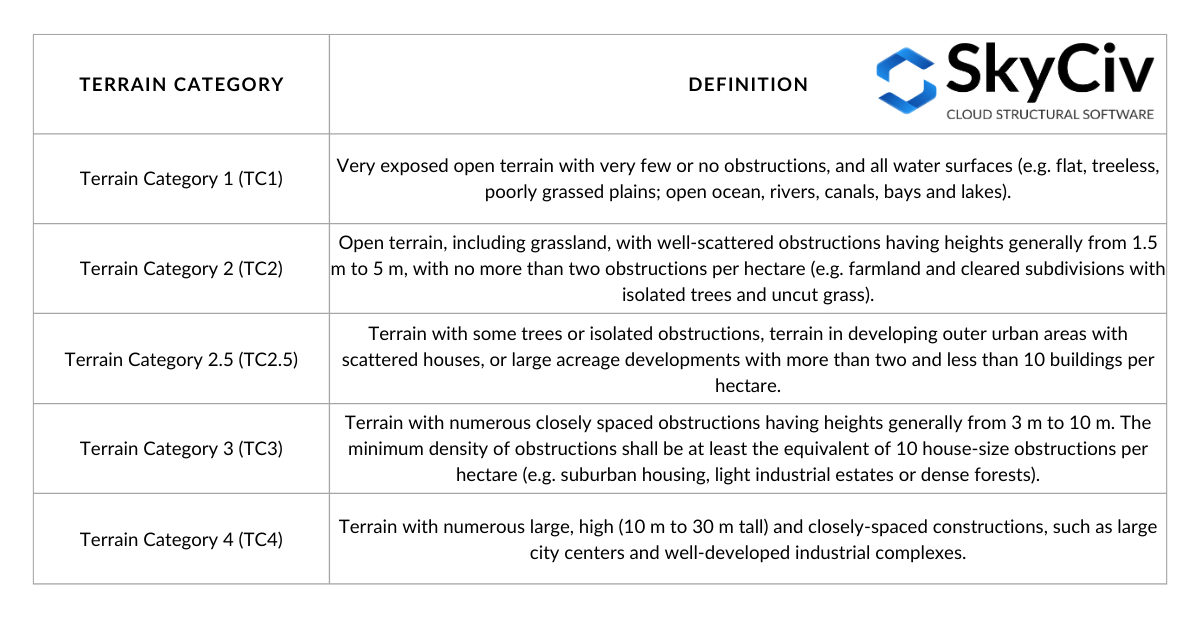
Tafel 4. Definitie van terreincategorieën zoals gedefinieerd in sectie 4.2.1 van AS / NZS 1170.2 (2021).
Bij het bepalen van de terreincategorie voor een richting, een lag -afstand gelijk aan \( 20 z \) Van de structuurlocatie moet worden verwaarloosd. Vanaf dit punt, een offsetafstand (gemiddelde afstand) van 500 m of \( 40 z), welke groter is, moet worden gebruikt zoals weergegeven in figuur 16 hieronder. De \( z \) De waarde is gelijk aan de gemiddelde dakhoogte, \( h \), wanneer het kleiner is dan of gelijk aan 25 m. Het is mogelijk dat binnen deze gemiddelde afstand meerdere terreincategorieën heeft, en als zodanig, lineaire interpolatie van moet worden gebruikt bij het bepalen van de \( M_{z,kat} \) waarden, Afhankelijk van de lengte van elke terreincategorie, zoals geïllustreerd in afbeelding 4.1 van AS / NZS 1170.2 (2021). In dit artikel, We zullen alleen een homogene terreincategorie overwegen binnen de gemiddelde afstand.
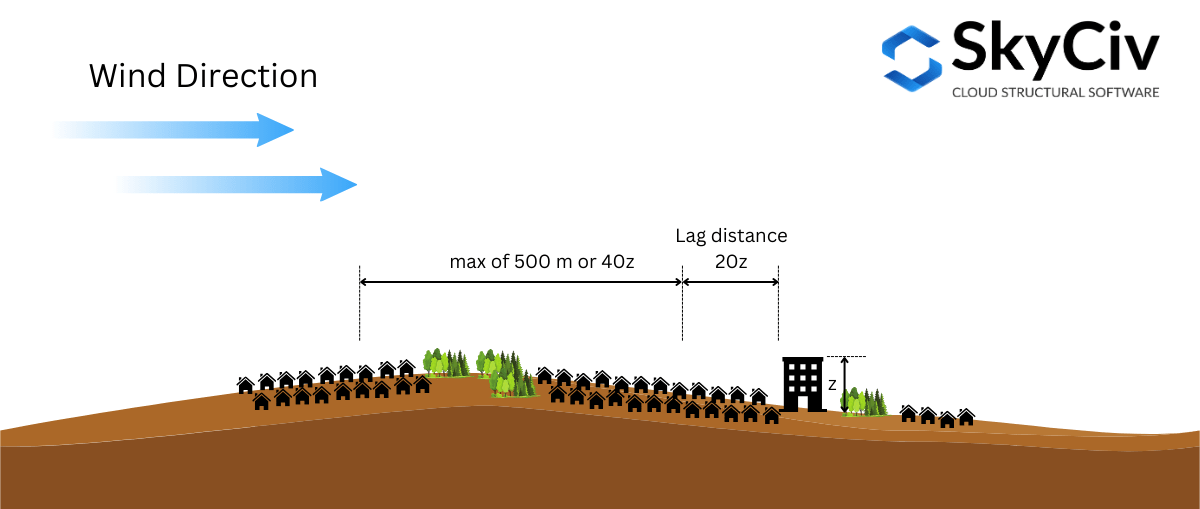
Figuur 16. Illustratie van de afstanden die worden gebruikt bij het bepalen van de terreincategorie op basis van AS/NZS 1170.2 (2021).
Om dit verder te illustreren, Laten we een voorbeeldlocatie gebruiken – Lat: 32° 43'46″S LNG: 151° 31'47″E – uitgaande van de gemiddelde dakhoogte \( h \) is 10 m ( waar \( 20z = 20h = 200 m \) en \( 40z = 400 m \)).
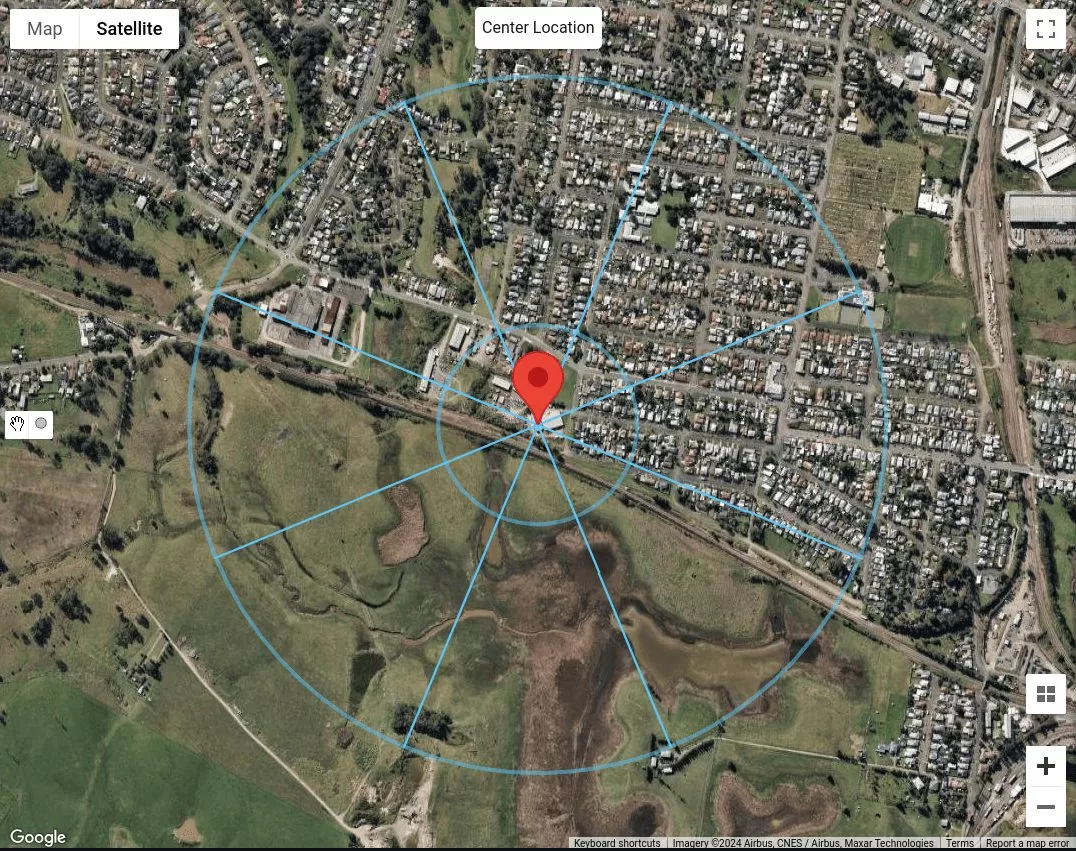
Figuur 17. De locatie locatie met lag -afstand gelijk aan 200 m en gemiddelde afstand gelijk aan 500 M voor elke windbronrichting.
Omdat we de categorie terrein alleen maar als homogeen beschouwen gedurende de gehele 500m of \( 40z \) afstand, We kunnen de richting van elke windbron al classificeren. Uitgaande van de gebouwen op n, NE en E, zijn gebouwen die zijn 5 naar 10 m lang, We kunnen deze classificeren naar het terreincategorie 3 (TC3) zoals weergegeven in de tabel 4. Voor windbronrichtingen SE, S, SW, en w, Omdat dit grasvlaktes zijn zonder obstakels, We kunnen deze classificeren als terreincategorie 1 (TC1). Uiteindelijk, Voor windbronrichting nw, We kunnen afleiden dat er meer dan twee zijn, maar minder dan 10 gebouwen per hectare, met verspreide huizen. Daarom, We kunnen dit classificeren als terreincategorie 2.5 (TC2.5).
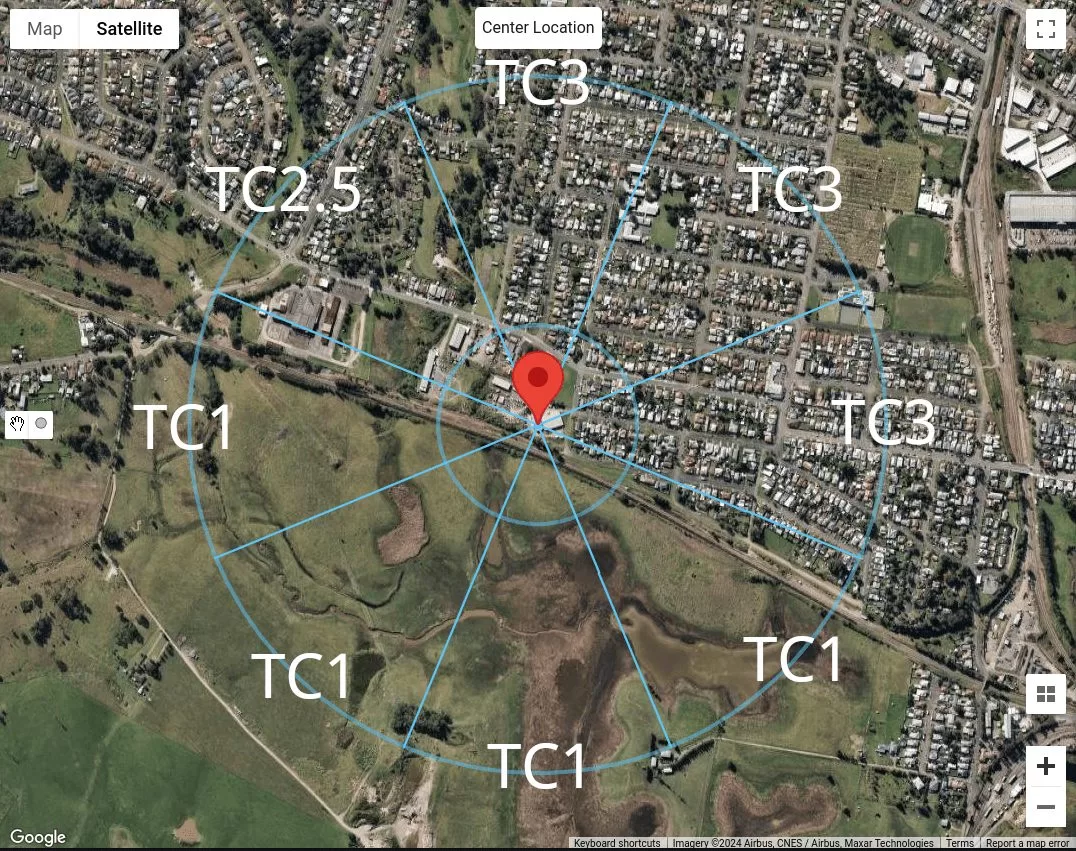
Figuur 18. Samenvatting van de classificatie van het terreincategorie voor elke windbronrichting voor onze monsterlocatie.
SkyCiv Load Generator gebruiken
In Skyciv Load Generator -versie v4.7.0, Nieuwe kaarttools worden geïntroduceerd – Meet afstand en Afstand stralen hulpmiddelen.
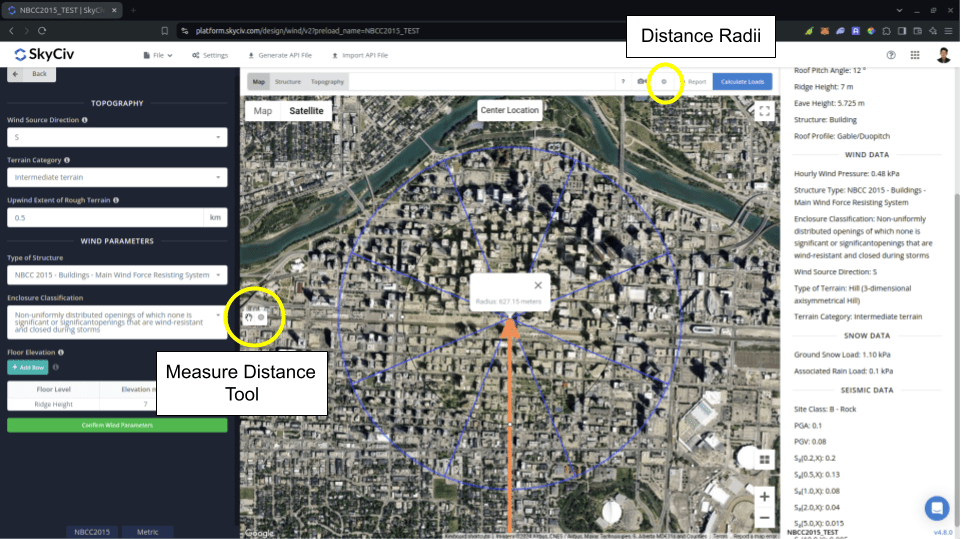
Figuur 19. Afstandsmeetinstrumenten geïntroduceerd in SkyCiv Load Generator.
De Meet afstand tool wordt gebruikt om een cirkel te genereren vanaf een aangeklikt punt op de kaart en de straal ervan in meters weer te geven. Op deze manier, u kunt de afstanden meten vanaf de locatie die wordt geanalyseerd tot bepaalde locaties. Dit kan worden gebruikt bij het meten van NBCC 2015 voor de Bovenwinds Omvang van ruw terrein gebruikt bij het berekenen Blootstellingsfactor \( C_{e} \). Als u op de gegenereerde cirkel klikt, wordt deze op de kaart gewist.
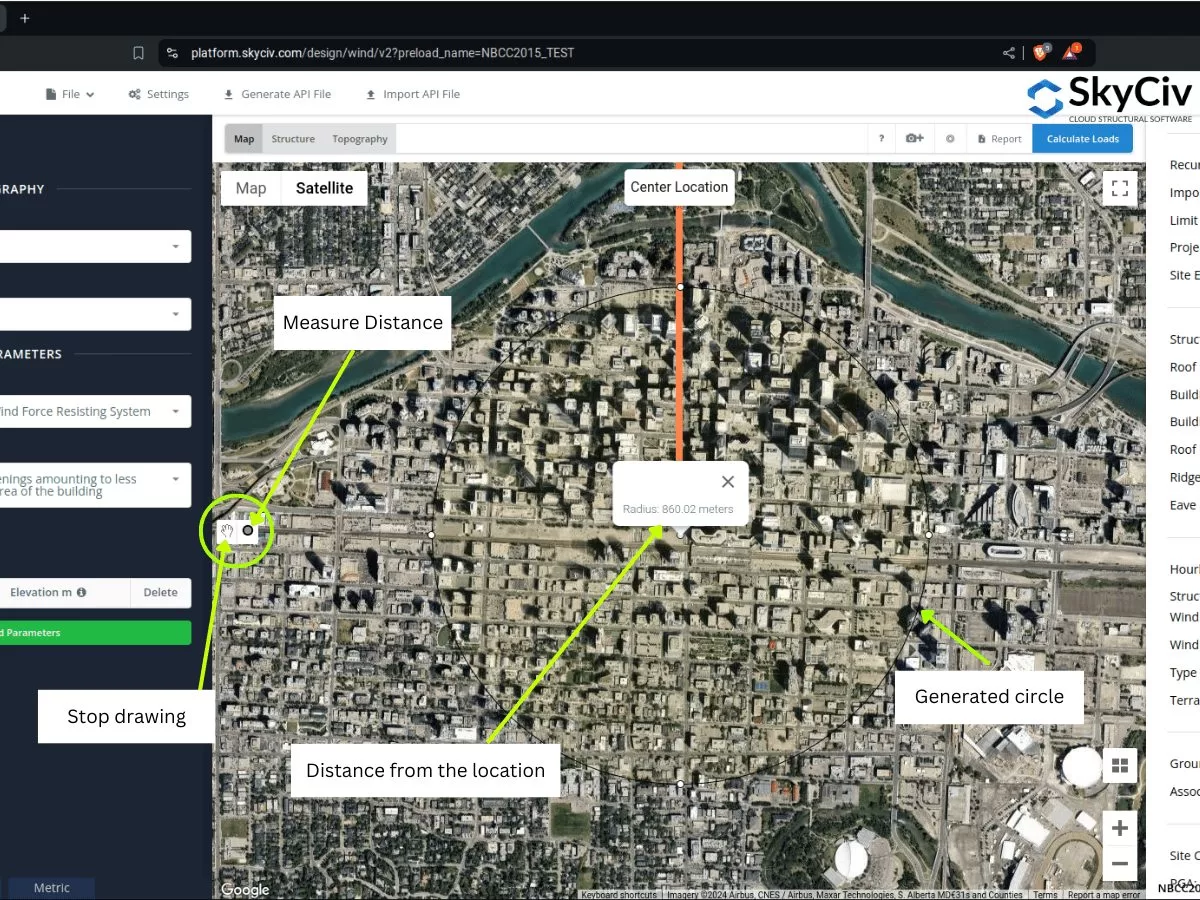
Figuur 20. Meet afstandsgereedschap dat een offset van de locatie creëert en de straal/offsetafstand van het midden wordt geïntroduceerd op Skyciv Load Generator.
Anderzijds, de Afstand stralen wordt geïntroduceerd zodat gebruikers voor elke windbroncategorie cirkels kunnen tekenen met gespecificeerde afstanden vanaf de locatie. Het is een toggle -knop om de afstandsstralen op de kaart te laten zien of te verbergen, met de locatie locatie als het midden van de cirkels.
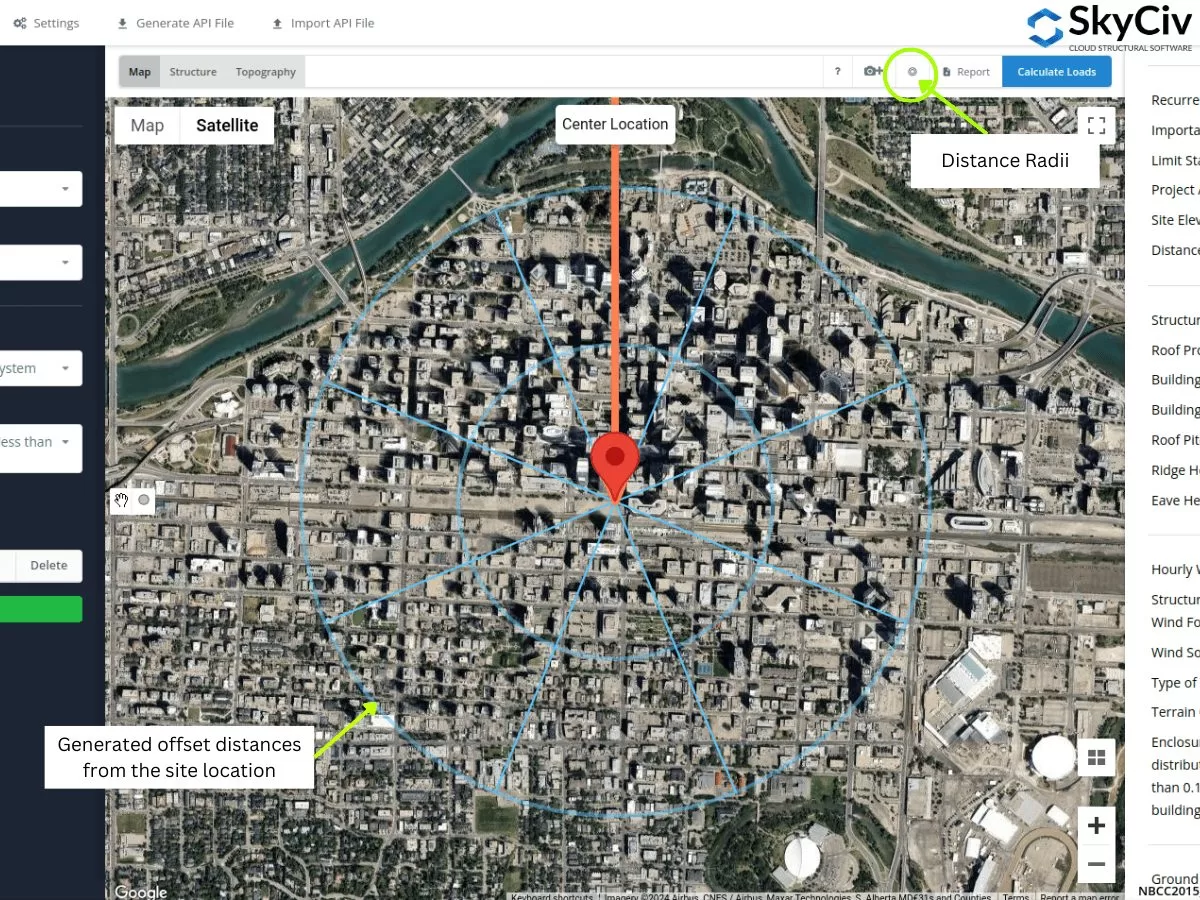
Figuur 21. Afstand radii tool die offsetafstanden heeft gespecificeerd van de locatielocatie geïntroduceerd op Skyciv Load Generator.
De radii -waarden kunnen worden bewerkt bij het openen van de instellingen.
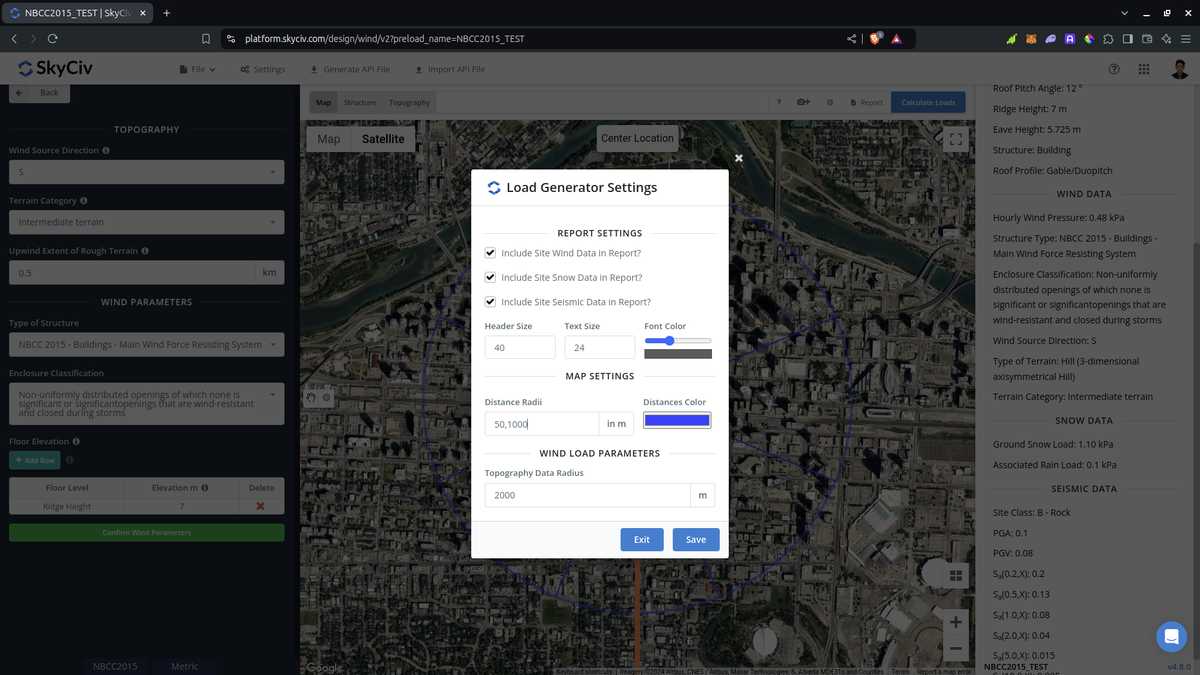
Figuur 22. Optie in instellingen om de afstanden voor de Distance Radii-tool in SkyCiv Load Generator te bewerken.
Houd er rekening mee dat gebruikers de afstandswaarden moeten bewerken, omdat deze niet automatisch worden berekend door de software. Dit gebruiken voor ASCE 7 en NBCC, De slechtste blootstelling of terreincategorie voor elke windbronrichting moet worden aangenomen. Met betrekking tot het gebruik ervan in AS/NZS 1170.2 (2021), De software gebruikt de radii -waarden niet om te berekenen voor het gemiddelde \( M_{z,kat} \) waarden. In plaats daarvan, De gemiddelde afstand wordt gebruikt als het toepasselijke bereik waar we een homogene terreincategorie kunnen toewijzen, het aannemen van de slechtste categorie voor elke richting van de windbron.
Uit de hierboven besproken secties, U kunt deze nieuwe tools gebruiken om de blootstellings- of terreincategorieën te bepalen voor elke aanwijzingen van de windbron. De bovenstaande procedures kunnen u een snelle terreinclassificatie geven van elke windbronrichting. Met behulp van GIS- en AI -tools, U kunt de criteria die we hierboven gebruiken verder controleren voor elke windbronrichting en een beter en efficiënt resultaat kan krijgen.

Bouwkundig ingenieur, Product ontwikkeling
MS Civiele Techniek
Referenties:
- Minimale ontwerpbelastingen voor gebouwen en andere constructies. (2017). ASCE / SEI 7-16. American Society of Civil Engineers.
- Nationale Onderzoeksraad van Canada. (2015). Nationale bouwcode van Canada, 2015. Nationale Onderzoeksraad van Canada.
- Normen Australië (2021), Structurele ontwerpacties. Een deel 2 Windacties, Australische/Nieuw -Zeelandse standaard AS/NZS1170.2:2021, Normen Australië, Sydney, NSW, Australië.
- Google Maps