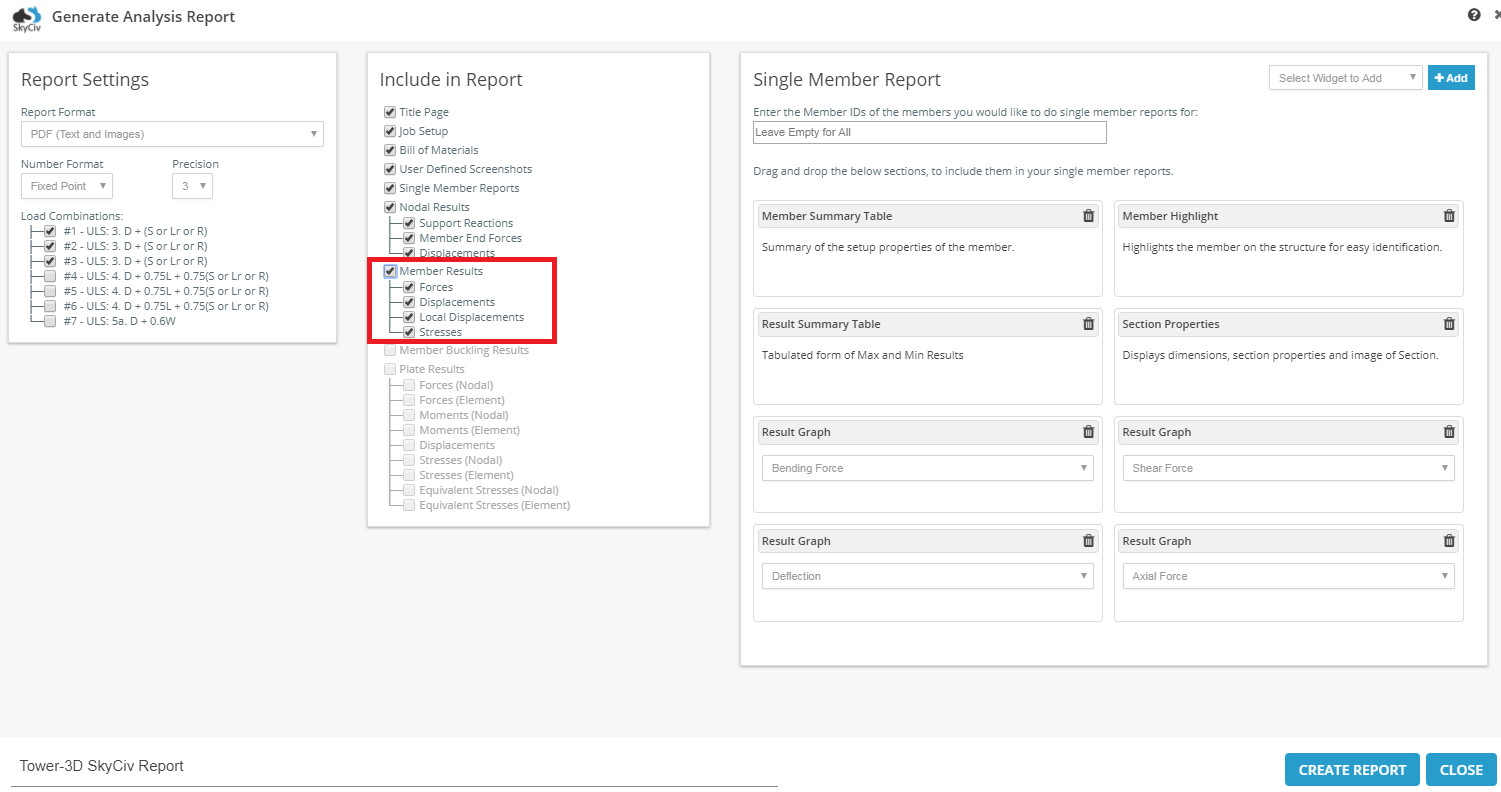
SkyCiv biedt een nuttige samenvatting van de resultaten van uw structuur in zijn analyserapport.
Klik gewoon op de Verslag doen van menu-knop aan de linkerkant om de pop-up te openen.
De ‘Ledenresultaten’ geselecteerde optie omvat resultaten op verschillende punten langs elk lid van uw structuur. Dit omvat de krachten en momenten van de interne leden (axiale kracht, dwarskracht, torsie, en moment), verplaatsingen van leden rond de globale assen (lengte en rotatie), verplaatsingen van leden rond de lokale assen (lengte en rotatie), en spanningen bij leden.
De groene cellen duiden de minimum(s) als de
rode cellen zijn de maximaal(s) voor dat specifieke resultaat.
Bijvoorbeeld, de rode cel gemarkeerd onder Z Moment zou het maximale Z Moment in de gehele structuur zijn. Hier is een voorbeeld van de presentatie van de interne ledenkrachten, met het bovengenoemde kleurenschema:
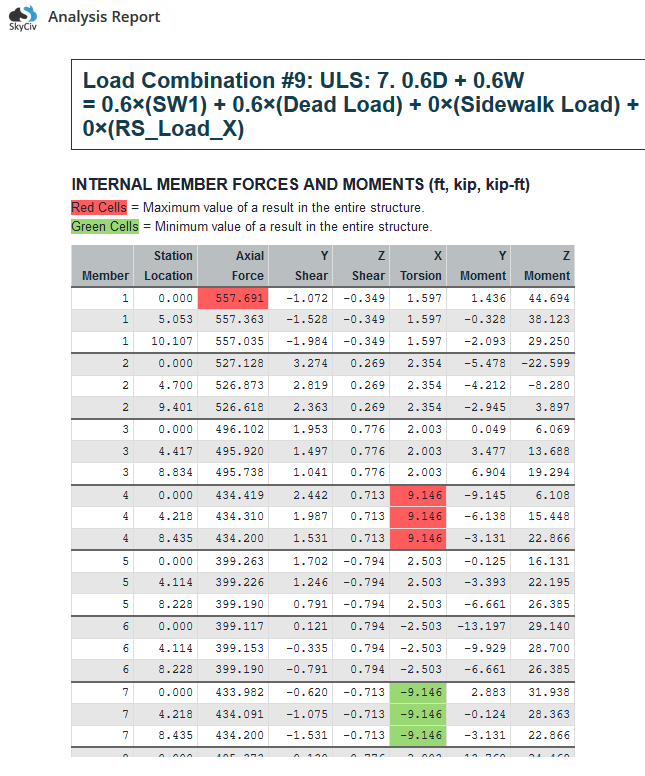
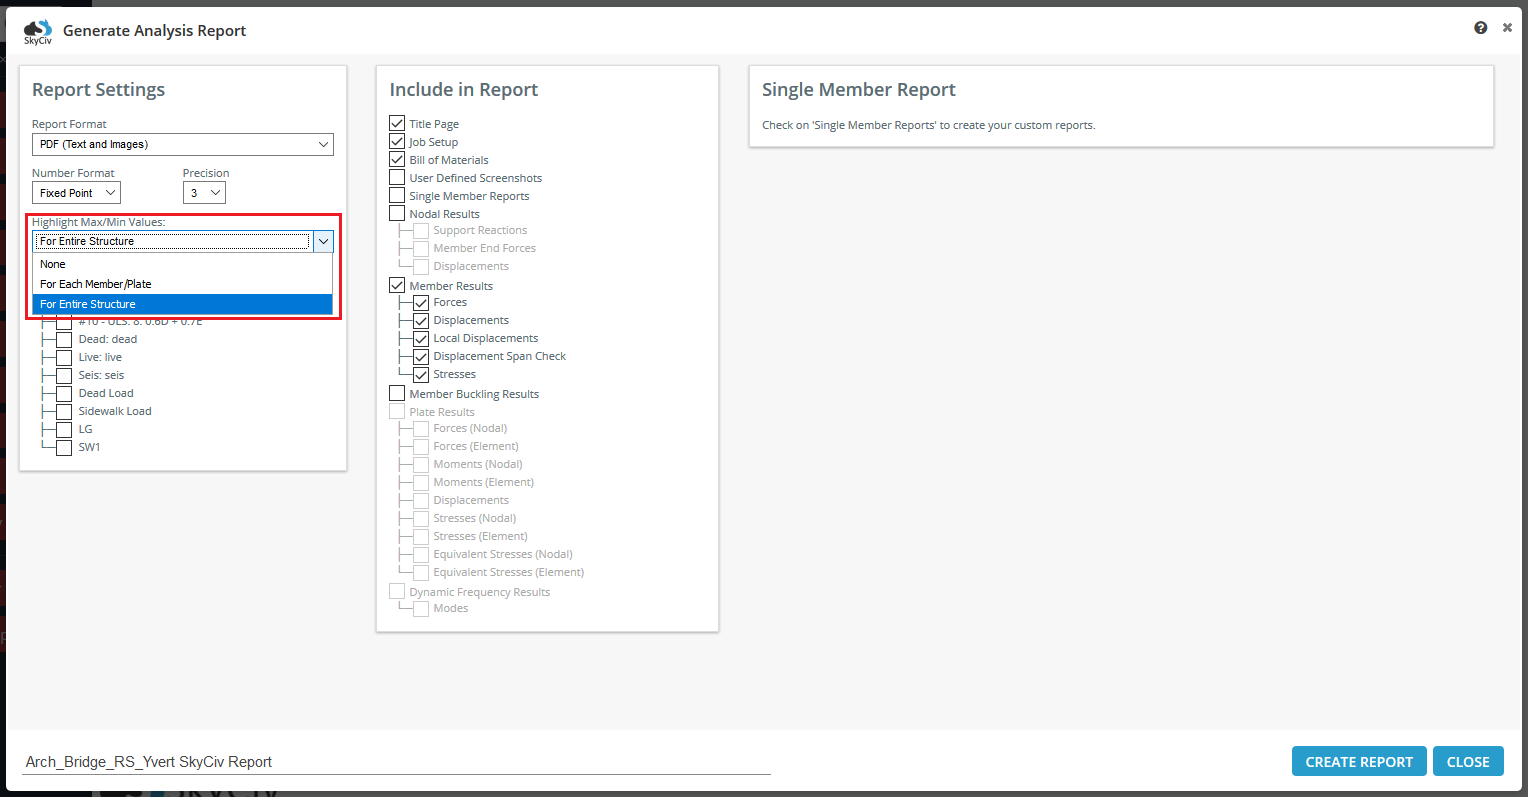
Merk bovenaan de tabel op hoe, er is een indicator van hoe de rode en groene cellen worden gedefinieerd. In dit voorbeeld, zij zijn de max en min in het hele project. U kunt deze optie zo wijzigen dat de maximale en minimale waarden voor worden gemarkeerd elk lid. Op de pagina Analyserapportopties, klik op de vervolgkeuzelijst ‘Max./Min. waarden markeren’’ om de beoogde optie te selecteren:
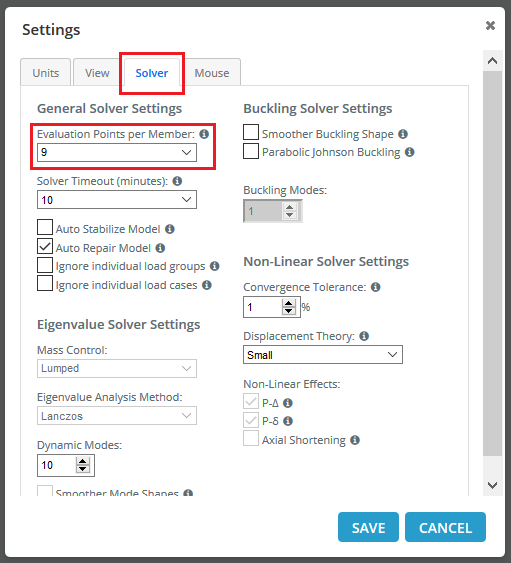
Het standaardaantal resultaten bij elk lid is 9, gelijkmatig verdeeld, maar dit kan worden verhoogd of verlaagd in de instellingen onder 'Evaluatiepunten per lid'.
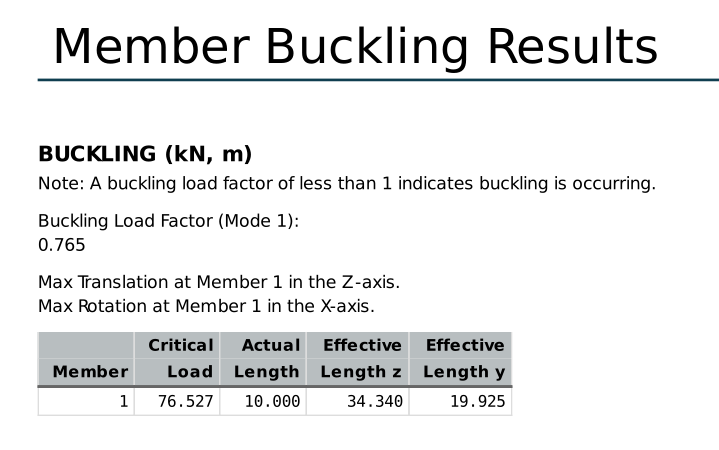
Resultaten van knikken van leden
SkyCiv biedt een nuttige samenvatting van de resultaten van uw structuur in zijn analyserapport.
Klik gewoon op de Verslag doen van menu-knop aan de linkerkant om de pop-up te openen.
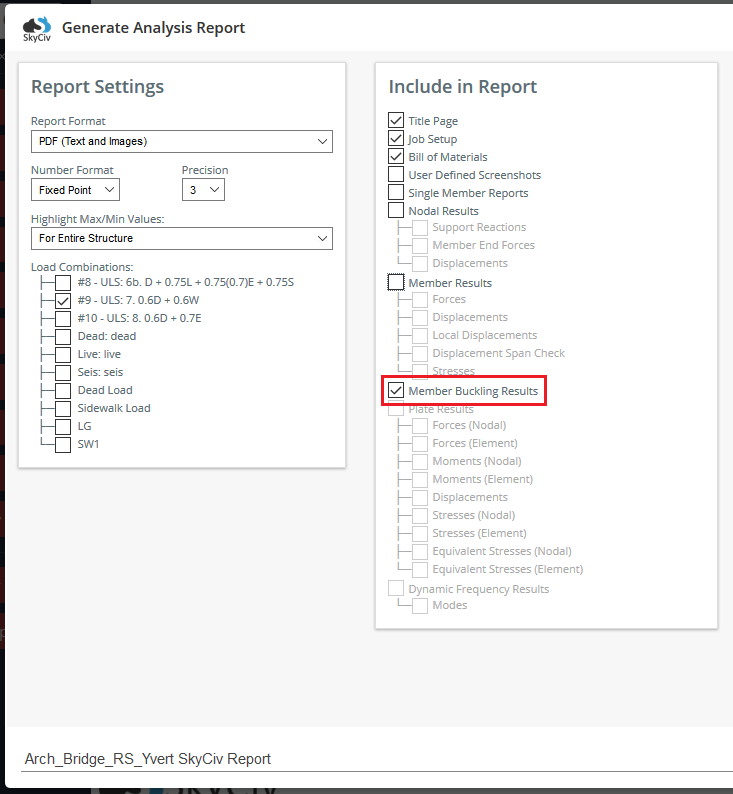
Als u een Lineair statisch + Knikken analyse, u heeft de mogelijkheid om de optie ‘Member Buckling Results’ te selecteren in de rapportagepop-up. Het biedt een samenvatting in tabelvorm van alle leden die knikken. De tabel bevat resultaten voor de kritische belasting, werkelijke lengte, effectieve lengte (lokale z- en y-richtingen). Zie het onderstaande voorbeeld. Bekijk onze softwaredocumentatie op Lineair statisch + Knikken analyse als u meer informatie wilt.
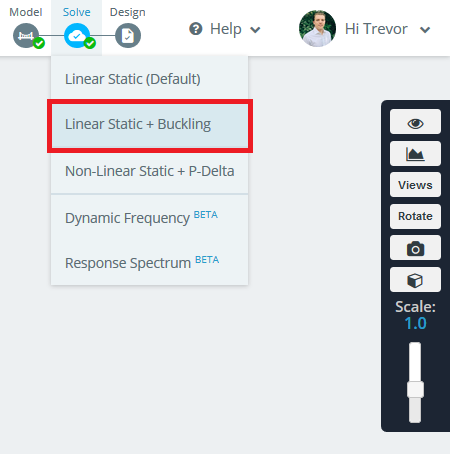
Na het oplossen, open de analyserapportopties en vink ‘Member Buckling Analysis’ aan’
De resultaten worden als volgt in het rapport weergegeven: