Descrizione generale
SkyCiv ha incluso una nuova potente funzionalità costituita dall'analisi dello spettro di risposta della piastra nella piattaforma. In questo articolo, tratteremo un esempio di un piccolo edificio, come mostra l'immagine seguente. Lo scopo principale è spiegare alcuni dettagli essenziali quando si esegue da soli un'analisi simile.
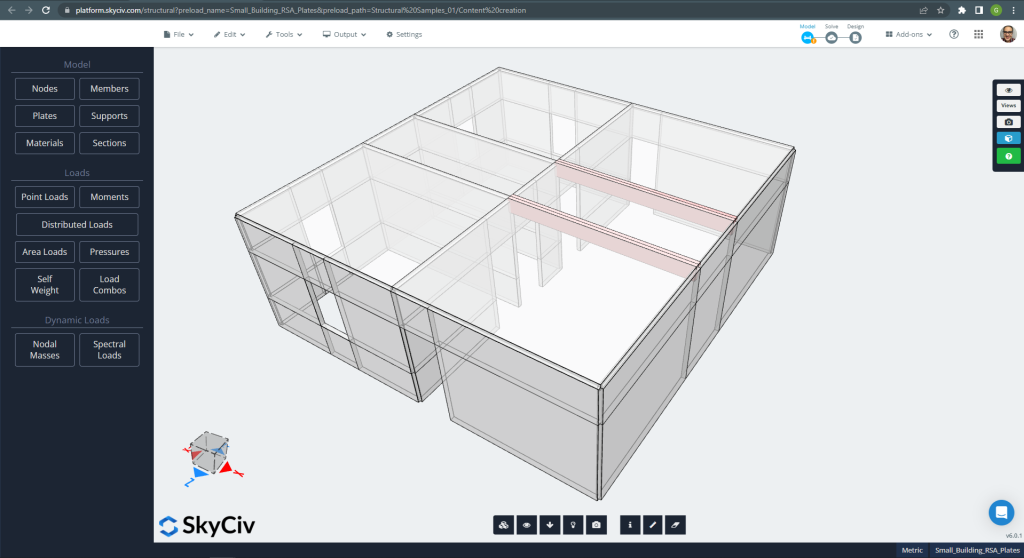
figura 1. Esempio di piccola costruzione
Puoi vedere che la piccola struttura in cemento armato ha pareti e solette costruite utilizzando l'elemento piastra SkyCiv. Quando si progetta l'edificio per carichi dinamici come i terremoti, la maggior parte dei codici di costruzione stabilisce alcuni metodi come la “Procedura o Analisi dello Spettro di Risposta”. (RSA).’
La RSA consiste nel prendere l'accelerazione del livello sismico di progetto attraverso una curva regolare data dalla normativa. Puoi leggere questi articoli di SkyCiv: Analisi dello spettro di risposta: Un esempio di costruzione e analisi dello spettro di risposta: Metodi di combinazione modale per ulteriori informazioni ed esempi Analisi dello spettro di risposta: Esempi di costruzione e Analisi dello spettro di risposta: Metodi di combinazione modale.
Se sei nuovo in SkyCiv, Iscriviti e testa tu stesso il software!
Modello agli elementi finiti: Analisi dinamica delle piastre
Una volta definiti la geometria e i materiali per l'esempio, il prossimo passo cruciale è eseguire un'analisi lineare di una struttura a maglie. Si prega di dare un'occhiata al modello in figura 2.
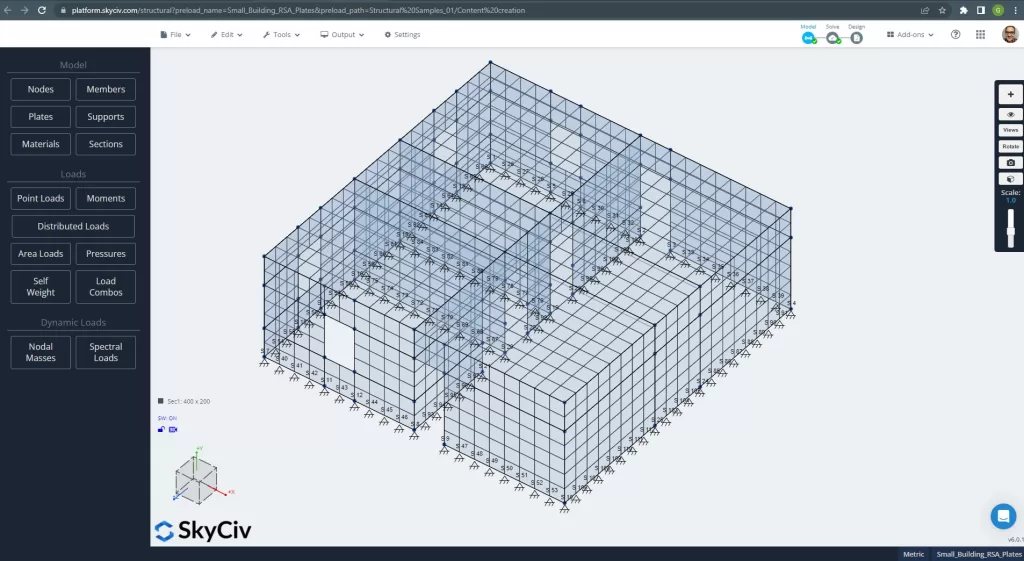
figura 2. Piccolo edificio a maglie
L'equazione del moto da risolvere quando si esegue un'analisi dello spettro di risposta ha la forma di:
\({Me}{\punto{X_e}}+{C_e}{\punto{X_e}}+{K_e}{X_e}={-\punto{X_0}{(t)}{Me}{J}}\)
Dove:
- \({Me}\) è la matrice coerente per le masse.
- \({C_e}\) è la matrice di smorzamento (Spesso, questo valore potrebbe essere calcolato come combinazione lineare delle matrici di rigidezza e massa \({C_e}={\alfa}{K_e}+{\beta}{M}\) ).
- \({K_e}\) è la matrice di rigidità.
- \({X_e}\) è il vettore spostamento rispetto alla base della struttura.
- \({X_0}{(t)}\) è il vettore di spostamento del suolo (Ha tutti i gradi di libertà: 3 spostamenti e tre rotazioni).
- \({J}\) è un vettore con componenti unitarie.
Due SkyCiv utilizzando il metodo degli elementi finiti per le piastre, la matrice \({Me}\) potrebbe essere ottenuto attraverso la seguente espressione per l'energia cinetica:
\({E_c}={\frac{1}{2}}{\int_{vol} {\rho}{\punto{x}^ 2}{dw}Vol}\) .
Scriviamo ora il \(X) spostamento in funzione dei suoi nodi e utilizzare alcune espressioni di interpolazione (\(N_{x}^{T}\)).
\({x}=N_{x}^{T} {x}\). Se inseriamo questo valore nell'equazione dell'energia, si ottiene:
\({E_c}={\frac{1}{2}}{\punto{x}^{T}}\{{\int_{vol}{\rho}{N}{N^T}{d}{Vol}}\} \punto{x} \)
Quindi, possiamo dirlo:
\( M = {\int_{vol}{\rho}{N}{N^T}{d}{Vol}}\)
La definizione della matrice sopra ci consente di eseguire un'analisi modale, necessario per l'analisi dinamica. figura 3 ci aiuta con alcuni input consigliati.
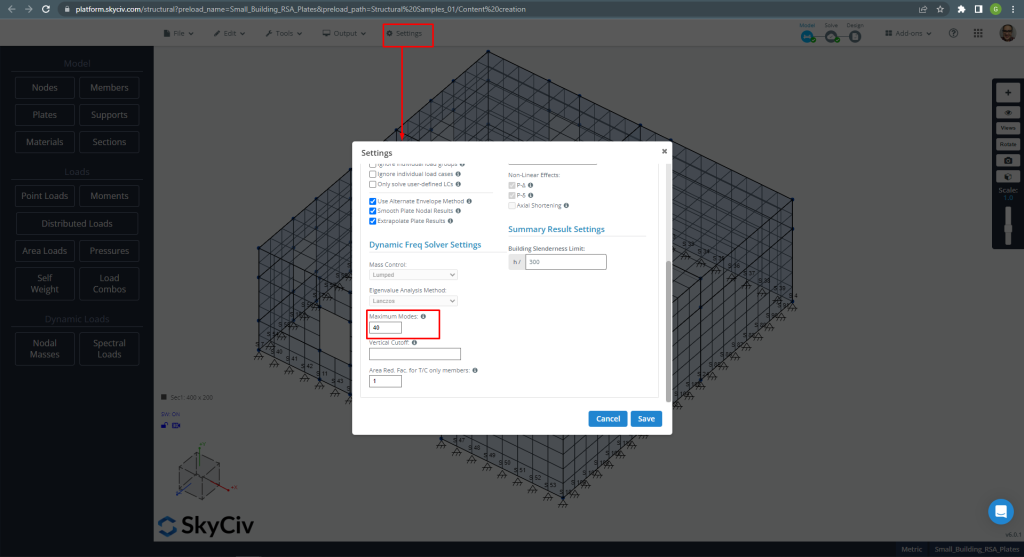
figura 3. Modalità massime considerate aumentate fino a 40
Si consiglia di aumentare il numero totale di modalità fino a soddisfare rigorosamente i codici. Ciò influenzerà i fattori totali di partecipazione di massa, che devono raggiungere un valore pari a 90%.
Carichi spettrali
Il passo successivo è definire i carichi spettrali. Possiamo includere una funzione personalizzata o prendere i casi precedentemente creati dalla piattaforma SkyCiv. Questo esempio utilizza per ciascuna direzione principale del piano di costruzione un lotto ASCE. Controllare gli input in Figura 4 e figura 5.
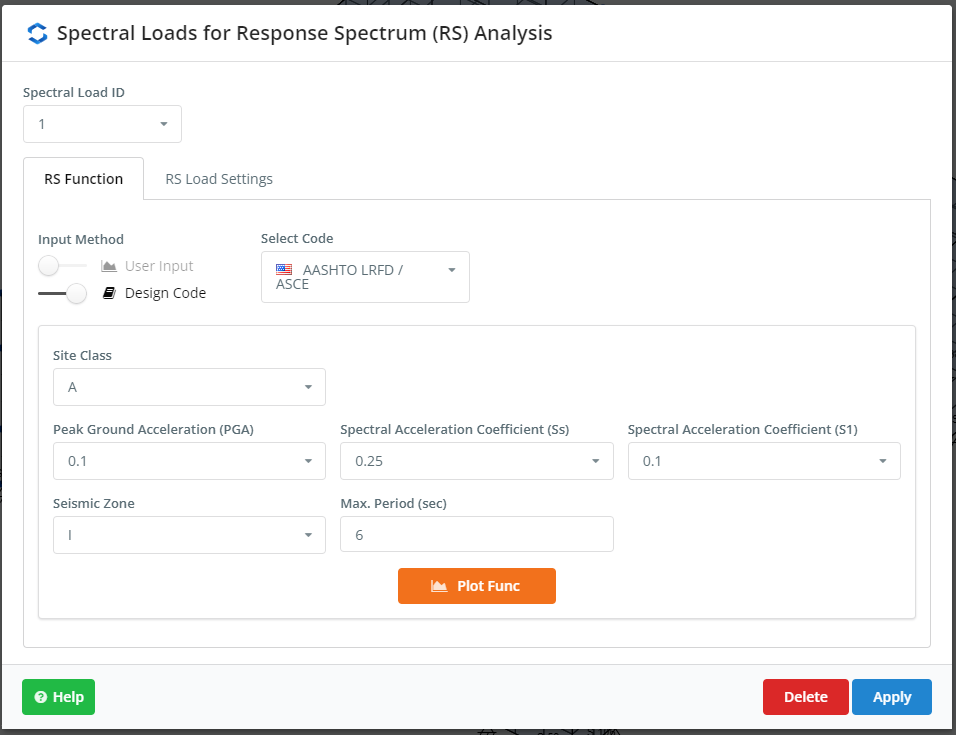
figura 4. Impostazioni per RSA, prima parte
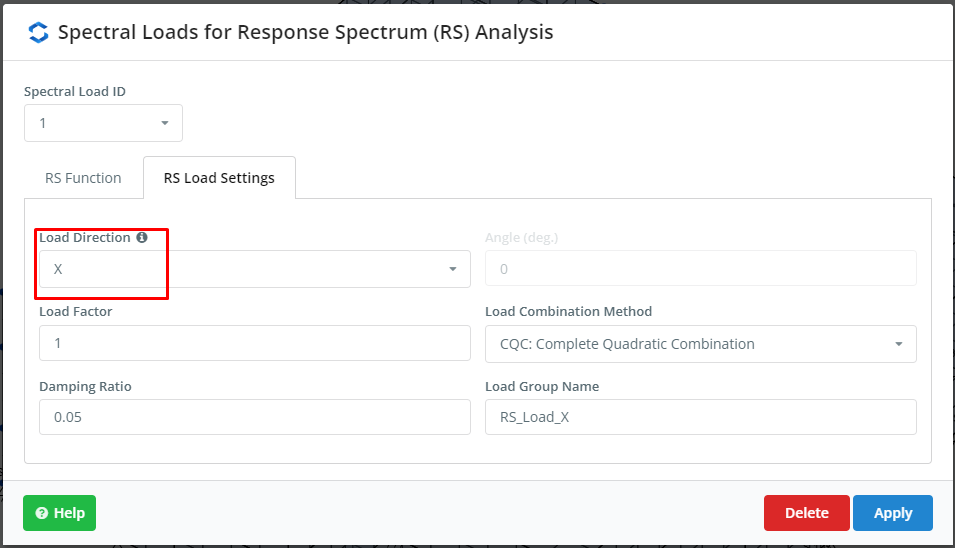
figura 5. Impostazioni per RSA, seconda parte
Se sei nuovo in SkyCiv, Iscriviti e testa tu stesso il software!
Analisi dei risultati e conclusioni
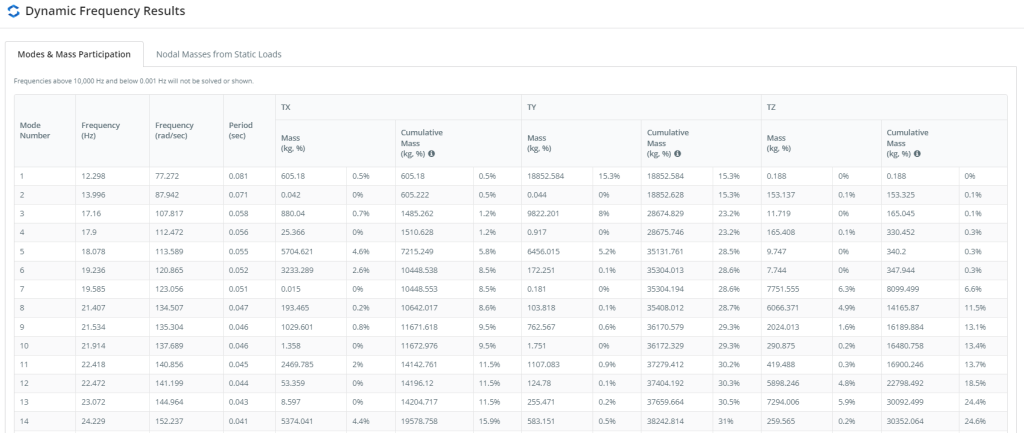
figura 6. Riepilogo modalità e partecipazione di massa, prima parte
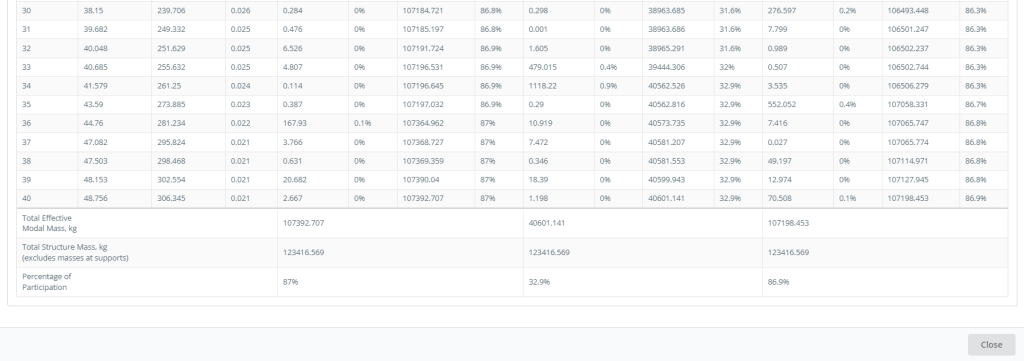
figura 7. Riepilogo modalità e partecipazione di massa, prima parte
Figure 6 e 7 dare le modalità e i valori della partecipazione di massa. Queste tabelle definiscono le principali modalità in ciascuna direzione del piano corrispondenti a quelle con i più alti valori di partecipazione di massa.
Modalità 24, T = 0.029 secondi, partecipazione di massa = 44.80 % "direzione x":
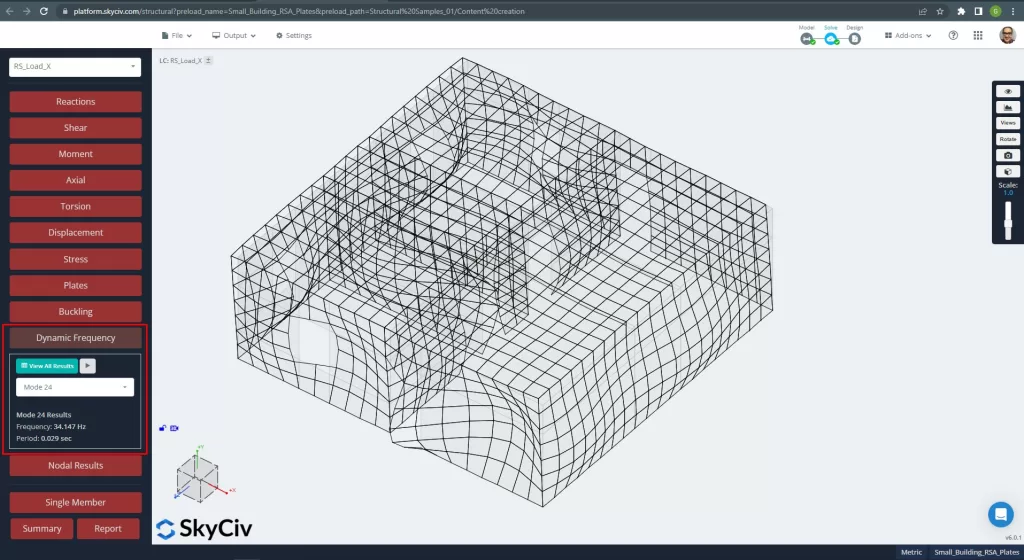
figura 8. Modalità modale principale per la direzione X.
Modalità 23, T = 0.030 secondi, partecipazione di massa = 41.80 % "direzione z":
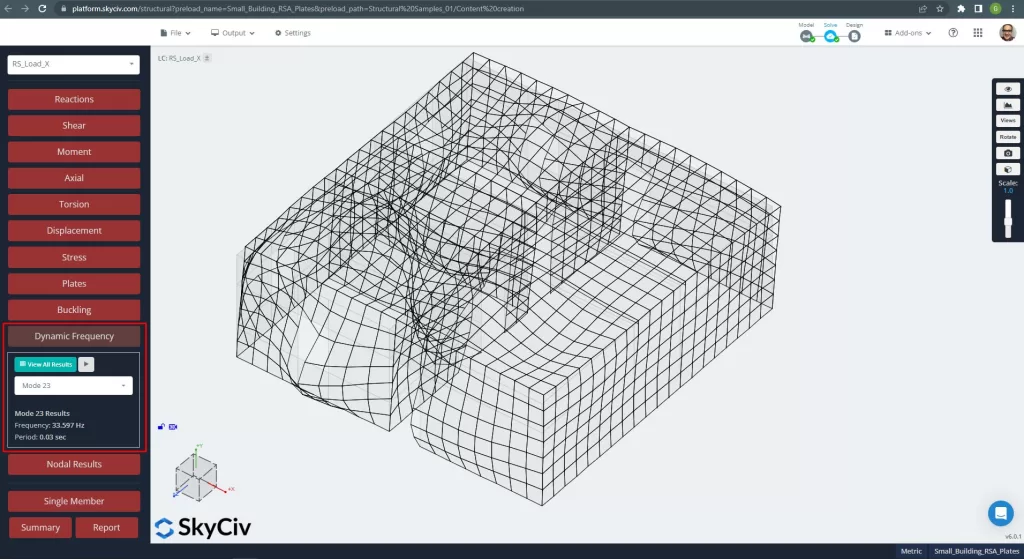
figura 9. Modalità modale principale per la direzione Z.
SkyCiv fornisce anche gli spostamenti, forze, sottolinea, e così via durante l'esecuzione della RSA. Le immagini seguenti ci aiutano a capire come si comportano gli edifici.
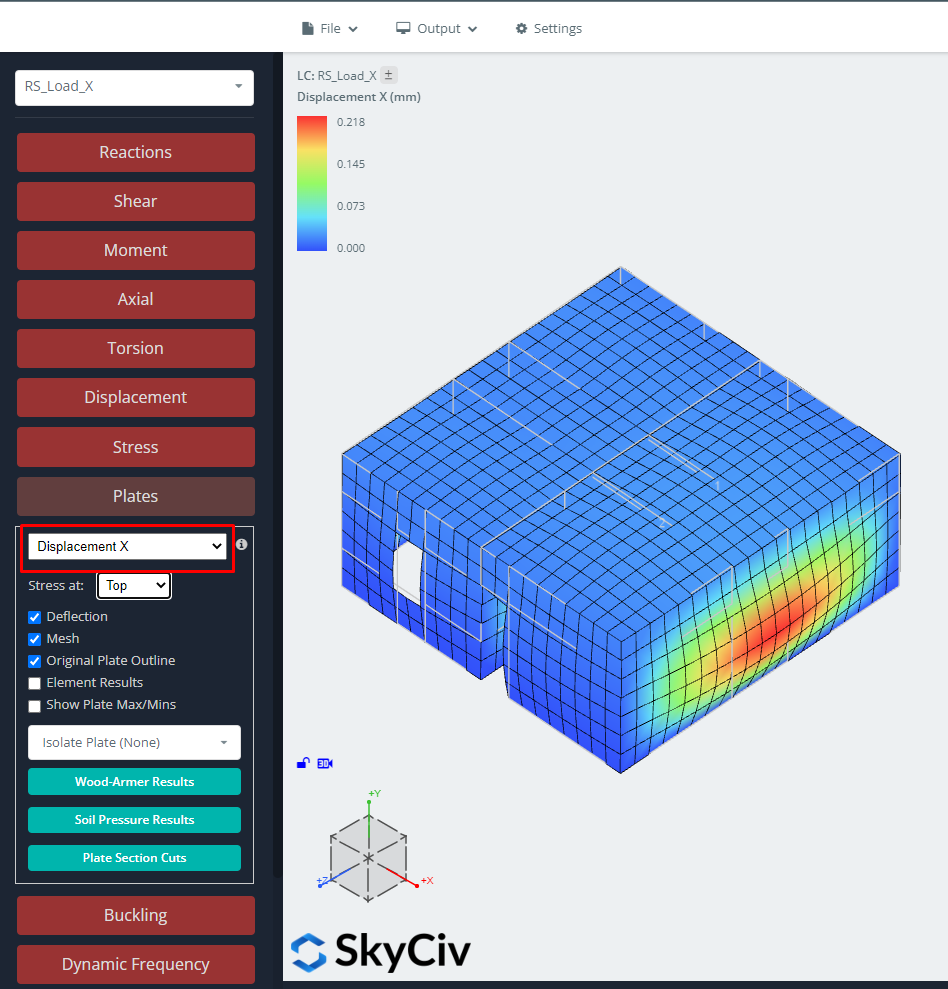
figura 10. Spostamenti nella direzione X per il caso di carico RSA.
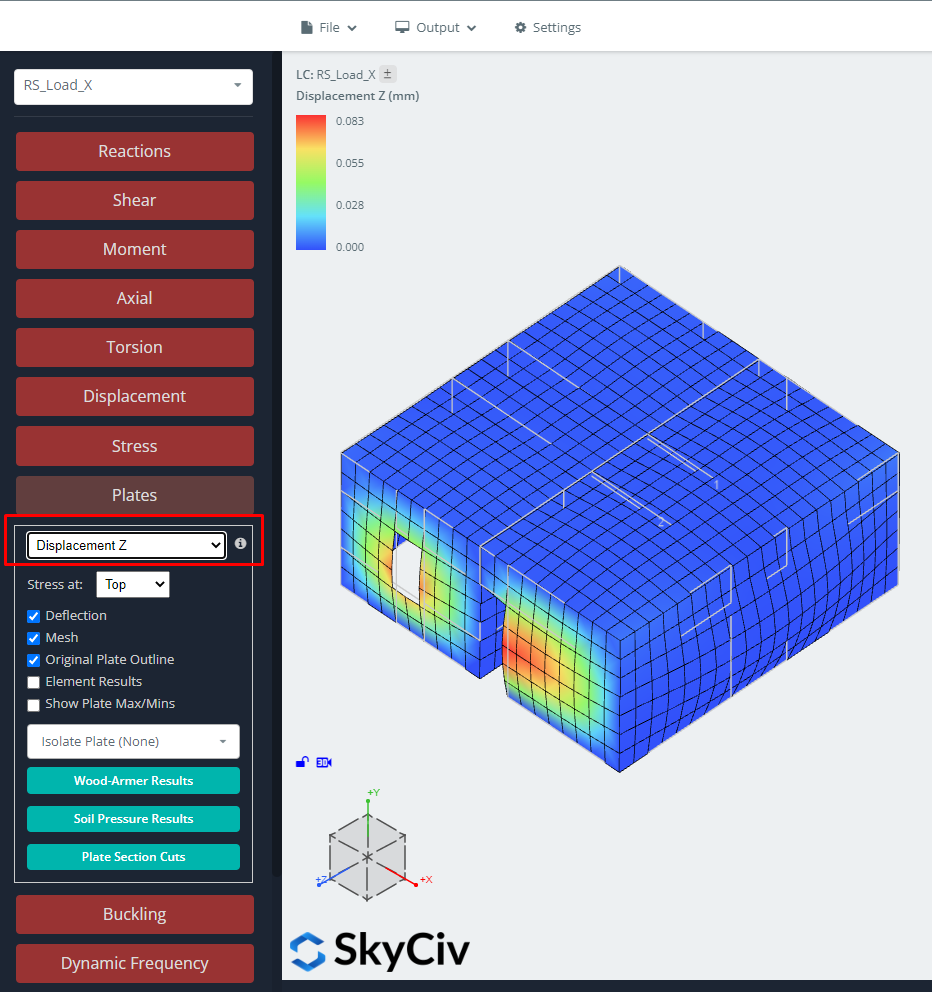
figura 11. Spostamento nella direzione Z per il caso di carico RSA.
Ora puoi progettare gli elementi della piastra con questi risultati. Ti consigliamo di leggere gli articoli SkyCiv su Plate Design: Modulo di progettazione della piastra ed esempi di lastre basate su codice applicato nei seguenti collegamenti: ACI, AS-3600 e Eurocodice 2.
Anche, con SkyCiv, possiamo ottenere le reazioni di base per il progetto della fondazione.
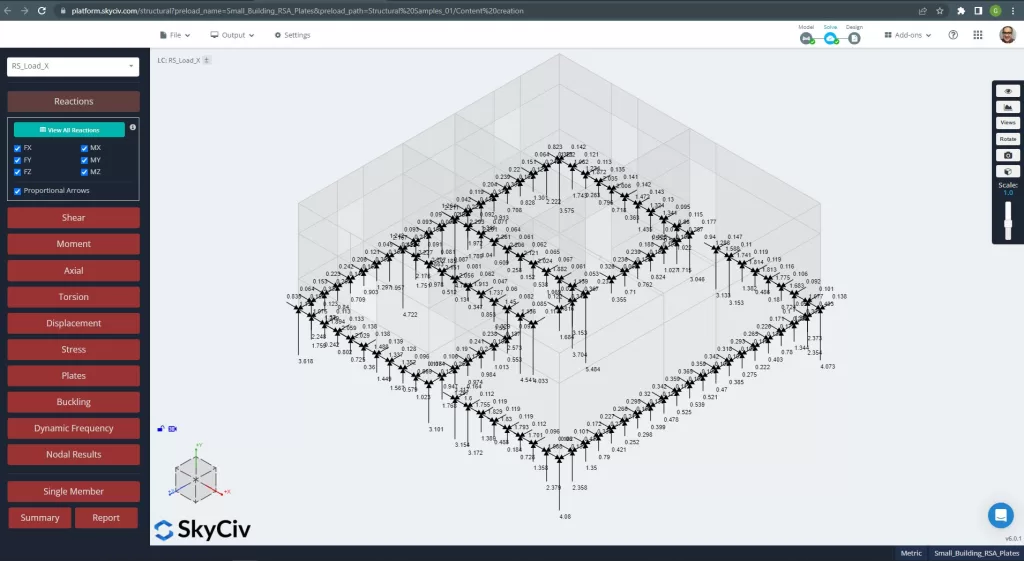
figura 12. Reazioni di base per il caso di carico RSA.
Basta essere consapevoli dei segnali dei risultati! Tutti sono arrivati in valori positivi o assoluti. Questo perché otteniamo i valori assoluti massimi per ciascun componente di progettazione quando utilizziamo un metodo RSA.
Se sei nuovo in SkyCiv, Iscriviti e testa tu stesso il software!

