¿Para qué sirven las líneas de tráfico??
Si desea obtener líneas de influencia para cualquier valor calculado en secciones y nodos del modelo, primero debe definir las rutas de movimiento para una unidad de carga en el preprocesador. La herramienta Líneas de tráfico le permite hacer esto.
Cómo funciona
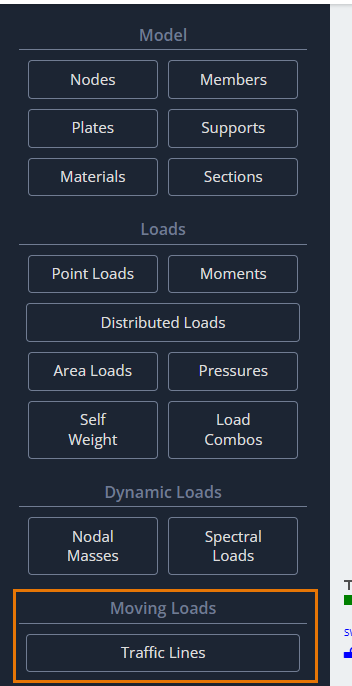
El botón para abrir la ventana de parámetros Líneas de tráfico se puede encontrar en el panel de interfaz del lado izquierdo en la sección Cargas en movimiento.
Después de hacer clic en este botón, El cuadro de diálogo Líneas de tráfico aparecerá en el área de modelado para definir sus parámetros..
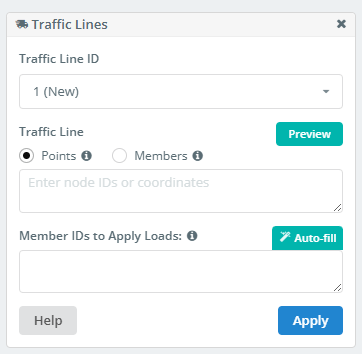
ID de línea de tráfico
Una lista de todas las líneas de tráfico definidas en el modelo.. Puedes elegir, editar, o eliminar uno si ya no es necesario.
Una línea de tráfico es una línea en el espacio.. Esta línea no tiene que ser recta.. Hay dos métodos para definir dicha línea.. El primer método utiliza puntos existentes en el modelo o entrada directa de coordenadas para los vértices de la línea..
Definición de líneas de tráfico mediante puntos
Agujas
Si la línea de tráfico es una línea recta., basta con definir dos puntos: el comienzo y el final.
- Definir por puntos, especifique los ID de nodo en este formato:
1;4 - Al definir puntos por coordenadas, deben ingresarse en este formato:
0,2.3,0; 210,2.3,0
ID de miembro para aplicar cargas
Obtener los valores de los factores en estudio., Se deben realizar una serie de análisis estáticos.. El programa necesita saber dónde colocar la unidad de fuerza en cada carga estática.. Para hacer esto, debes definir un conjunto de miembros.
Se aplicará la fuerza unitaria y se crearán casos de carga en los puntos de intersección/superposición de estos miembros con la línea de tráfico.. Este proceso ocurre automáticamente cuando se ejecuta el análisis..
Cuantas más intersecciones tengas, cuanto más precisa sea la línea de influencia que obtendrás. sin embargo, demasiadas intersecciones llevarán a largos tiempos de cálculo. Elija un número razonable.
- La lista de miembros se ingresa en el formato:
1, 2, 3, 4 - Usar “Autocompletar”. La lista se definirá automáticamente y luego se podrá editar manualmente..
Definición de líneas de tráfico utilizando miembros
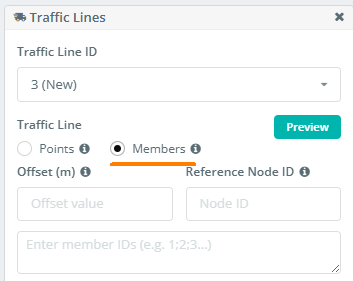
Alternativamente, Puede definir la ruta de la línea de tráfico utilizando una cadena de miembros.. Este enfoque es particularmente útil cuando el camino previsto es curvo y sigue la curvatura de un miembro estructural. (como la viga de un puente, etc.).
Para hacer esto, ingrese los miembros de la ruta en la lista en el formato: 1;2;7;4;5;12… o 1-25 si los miembros de la cadena son secuenciales.
Compensar
Este campo define la distancia de desplazamiento desde la cadena de miembros especificada.. Por lo tanto, Es útil si la línea de tráfico necesita seguir la forma de la cadena de miembros pero no su posición exacta..
ID del nodo de referencia
aquí, especificará el ID del nodo que define la dirección del desplazamiento de la línea de tráfico de la cadena de miembros especificada.
Finalmente, después de definir todos los parámetros, cadera-copia-jack-vigas Aplicar para agregar la línea de tráfico a la lista.
Líneas de influencia
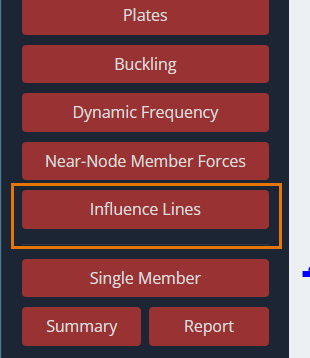
Después de ejecutar el análisis en el modelo con líneas de tráfico definidas, Puedes analizar los resultados como líneas de influencia.. Para hacer esto, debes encontrar el Líneas de influencia Botón en el panel de interfaz del lado izquierdo en el posprocesador..
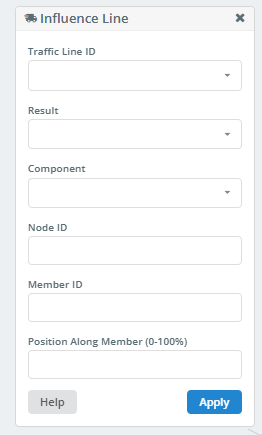
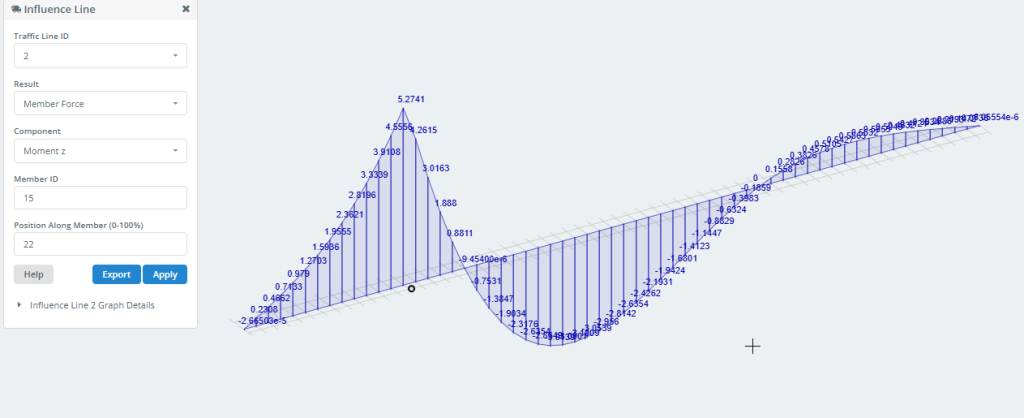
Después de hacer clic en este botón, la Línea de influencia Aparecerá un cuadro de diálogo en el área de modelado para definir sus parámetros..
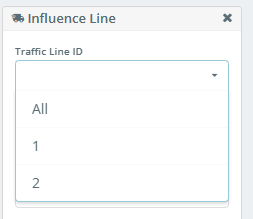
ID de línea de tráfico
En esta lista desplegable, puede seleccionar el ID de la línea de tráfico para la cual se construirá la línea de influencia. También puede crear líneas de influencia para todas las líneas de tráfico seleccionando “Todos”.
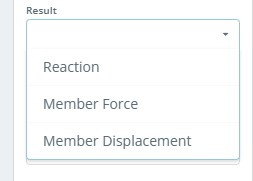
Resultado
Esta lista le permite seleccionar el tipo de resultado para construir la línea de influencia..
Componente
Esta lista muestra los valores resultantes para las reacciones en los nodos admitidos., o fuerzas y desplazamientos en secciones de miembros. El contenido de esta lista depende de la selección en el “Resultado” lista.
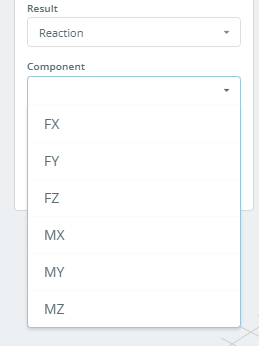
Si “Resultado” se establece en Reacción, la lista se verá así:
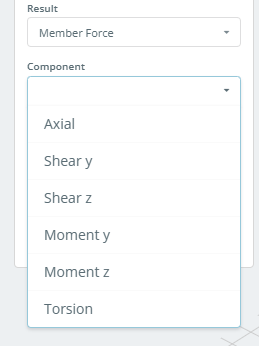
Si “Resultado” se establece en Fuerza miembro, la lista se verá así:
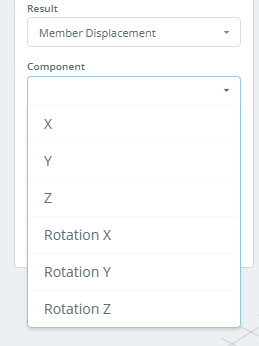
Si “Resultado” se establece en Desplazamiento de miembros, la lista se verá así:
ID de nodo
Si “Resultado” se establece en Reacción, debe especificar el ID del nodo admitido para el cual se construirá la línea de influencia.
Identificación de miembro
Si “Resultado” se establece en Fuerza miembro o Desplazamiento de miembros, debe especificar el ID del miembro para el cual se construirá la línea de influencia.
Posición junto al miembro (0-100%)
Este campo especifica la posición de la sección en el miembro para el cual se construirá la línea de influencia.. La coordenada de la sección se establece como un porcentaje de la longitud total del miembro., medido desde el inicio del miembro.
Después de hacer clic en el Aplicar ,, la línea de influencia se traza gráficamente en el modelo.
El Exportar El botón le permite guardar los datos de la Línea de Influencia en su computadora como un archivo de Excel..
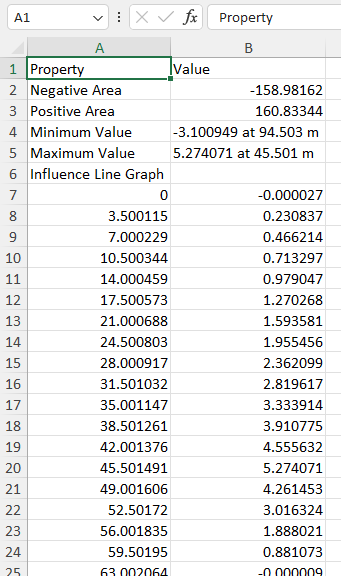
También puedes obtener esta información haciendo clic en Detalles del gráfico.
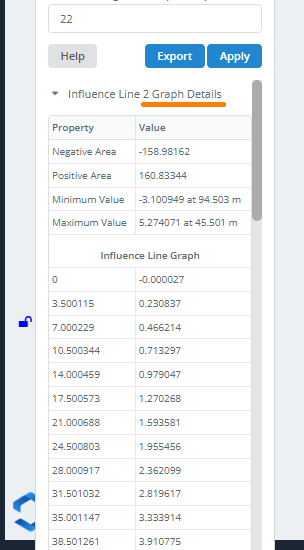
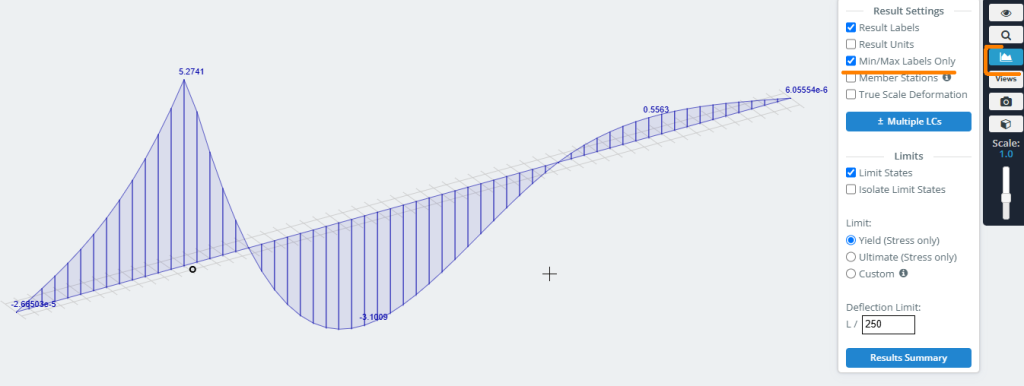
Para mostrar solo los valores mínimo/máximo en el gráfico, use las siguientes configuraciones en el menú del lado derecho: