Для чего нужны полосы движения?
Если вы хотите получить линии влияния для любых расчетных значений в сечениях и узлах модели, сначала необходимо определить пути движения единичной нагрузки в препроцессоре. Инструмент «Линии движения» позволяет это сделать..
Как это работает
Кнопка открытия окна параметров «Линии движения» находится на левой панели интерфейса в разделе «Движущиеся нагрузки»..
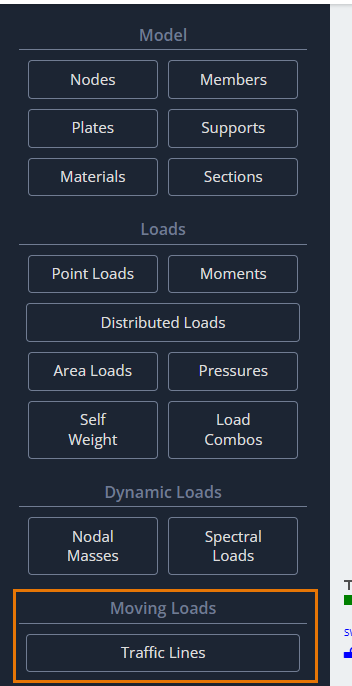
После нажатия этой кнопки, в области моделирования появится диалоговое окно «Линии движения» для определения его параметров.
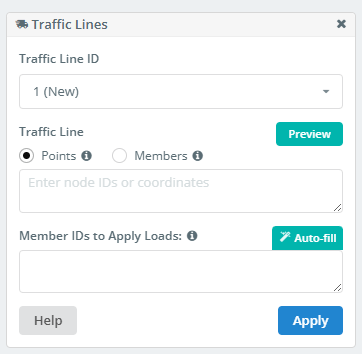
Идентификатор линии трафика
Список всех линий движения, определенных в модели.. Вы можете выбрать, редактировать, или удалите его, если он больше не нужен.
Линия движения — это линия в пространстве.. Эта линия не обязательно должна быть прямой. Существует два метода определения такой линии.. Первый метод использует существующие точки модели или прямой ввод координат вершин линии..
Определение линий движения с помощью точек
Очки
Если линия движения прямая, достаточно определить две точки: начало и конец.
- Определить по баллам, укажите идентификаторы узлов в этом формате:
1;4 - При определении точек по координатам, они должны быть введены в этом формате:
0,2.3,0; 210,2.3,0
Идентификаторы элементов для приложения нагрузок
Для получения значений изучаемых факторов, необходимо выполнить серию статических анализов. Программа должна знать, где разместить единицу силы при каждой статической нагрузке.. Сделать это, вы должны определить набор членов.
Будет применена единичная сила и созданы варианты нагрузки в точках пересечения/суперпозиции этих элементов с линией движения.. Этот процесс происходит автоматически при запуске анализа..
Чем больше у вас пересечений, тем точнее линию влияния вы получите. тем не мение, слишком много пересечений приведет к длительному времени расчета. Выберите разумное количество.
- Список участников вводится в формате:
1, 2, 3, 4 - Использовать “Автозаполнение”. Список будет определен автоматически и затем может быть отредактирован вручную..
Определение линий трафика с помощью элементов
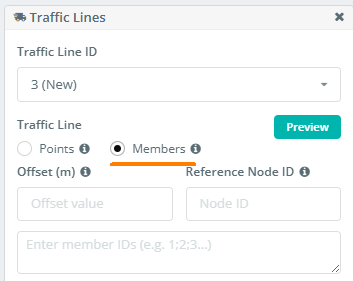
альтернативно, вы можете определить путь линии движения, используя цепочку участников. Этот подход особенно полезен, когда предполагаемая траектория изогнута и повторяет кривизну элемента конструкции. (как балка моста, и т.п.).
Сделать это, введите элементы пути в список в формате: 1;2;7;4;5;12… или 1-25 если члены цепочки последовательные.
Компенсировать
Это поле определяет расстояние смещения от указанной цепочки элементов.. Следовательно, это полезно, если линия движения должна повторять форму члена цепи, а не ее точное положение..
Идентификатор эталонного узла
Вот, вы укажете идентификатор узла, определяющего направление смещения линии трафика от указанной цепочки участников.
В завершение, после определения всех параметров, Поверните вид, чтобы можно было легко выбрать две общие стропила с помощью выбора слева направо. Подать заявление добавить линию трафика в список.
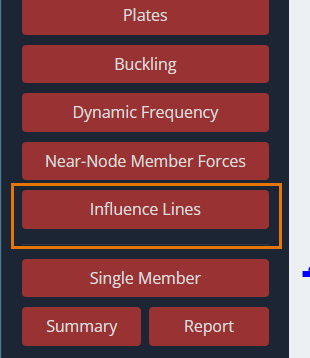
Линии влияния
После запуска анализа модели с заданными линиями движения., вы можете анализировать результаты как линии влияния. Сделать это, вы должны найти Линии влияния кнопка на левой интерфейсной панели постпроцессора.
После нажатия этой кнопки, в Линия влияния в области моделирования появится диалоговое окно для определения его параметров.
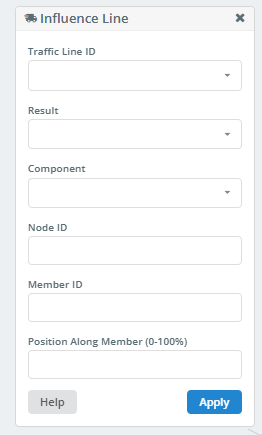
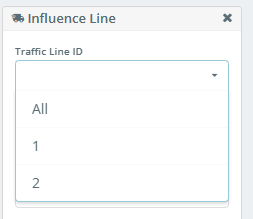
Идентификатор линии трафика
В этом раскрывающемся списке, вы можете выбрать ID линии трафика, для которой будет построена линия влияния. Вы также можете построить линии влияния для всех линий движения, выбрав “Все”.
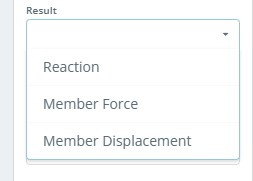
результат
Этот список позволяет выбрать тип результата для построения линии влияния..
Составная часть
В этом списке показаны результирующие значения реакций на поддерживаемых узлах., или силы и перемещения в секциях элементов. Содержимое этого списка зависит от выбора в “результат” список.
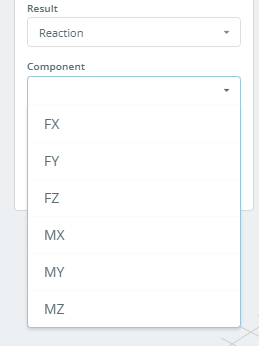
Если “результат” установлен в Реакция, список будет выглядеть так:
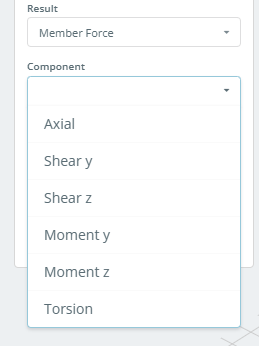
Если “результат” установлен в Членская группа, список будет выглядеть так:
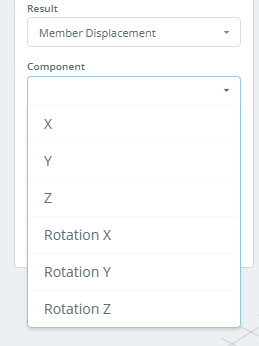
Если “результат” установлен в Смещение членов, список будет выглядеть так:
ID узла
Если “результат” установлен в Реакция, необходимо указать ID поддерживаемого узла, для которого будет построена линия влияния.
ID пользователя
Если “результат” установлен в Членская группа или Смещение членов, необходимо указать ID участника, для которого будет построена линия влияния.
Позиция вдоль члена (0-100%)
В этом поле указывается положение сечения на элементе, для которого будет построена линия влияния.. Координата сечения задается в процентах от общей длины элемента., измеряется от начала члена.
После нажатия кнопки Подать заявление кнопка, линия влияния графически нанесена на модель.
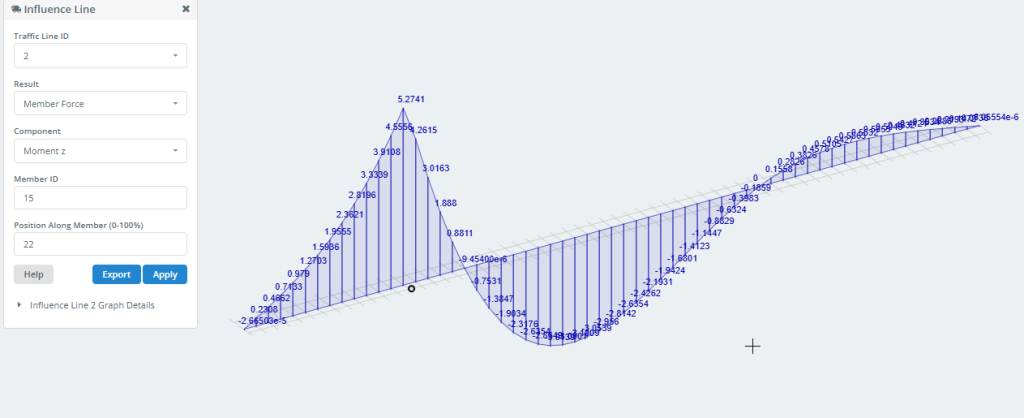
В Экспорт Кнопка позволяет сохранить данные Линии Влияния на компьютер в виде файла Excel..
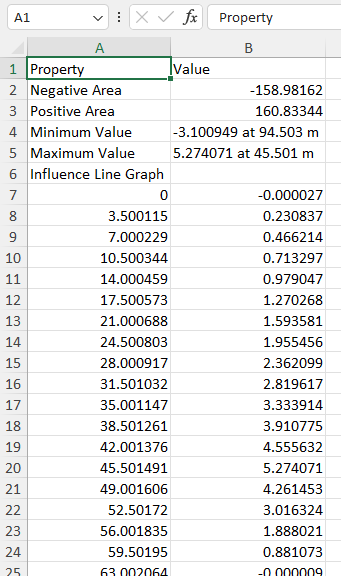
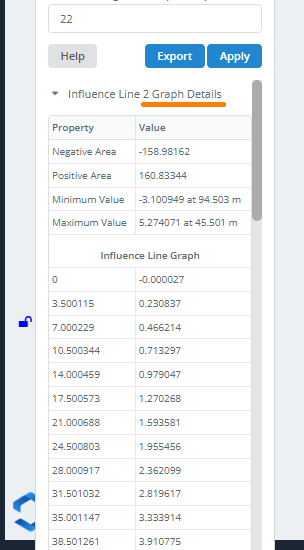
Вы также можете получить эту информацию, нажав на Детали графика.
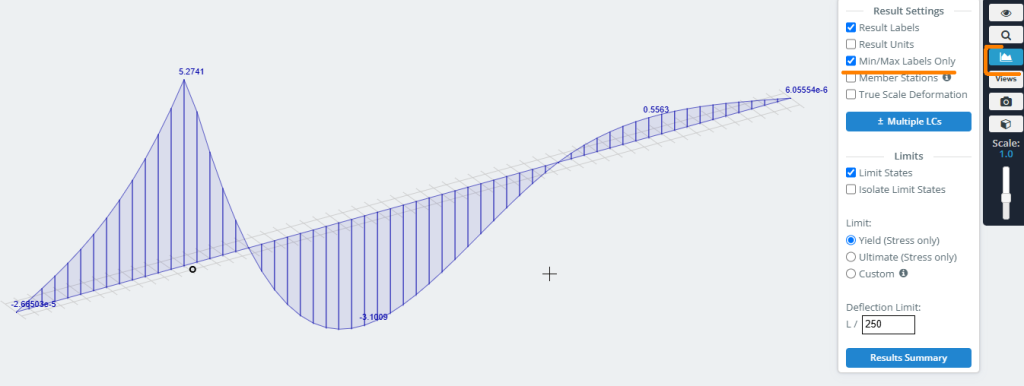
Чтобы отобразить на графике только значения Min/Max, используйте следующие настройки в правом меню: