
Concrete Section Design — Walkthrough
Overview
SkyCiv Concrete Section Design (CSD) is part of SkyCiv’s reinforced concrete design software. It checks any concrete cross-section with any reinforcement layout. Select a design code and a shape, place bars, set parameters and loads, then read capacities, stresses, neutral axis position, interaction surfaces and moment-curvature plots, and export a report.
The app runs as six tabs, left to right:
- Details: project and engineer information for the report.
- Concrete Section: the shape, its dimensions and its concrete material.
- Reinforcement: bars, layers, sizes, cover and steel material.
- Parameters: code and analysis settings.
- Loading: the design actions to check.
- Results: capacities, checks, plots and the report.
Startup window
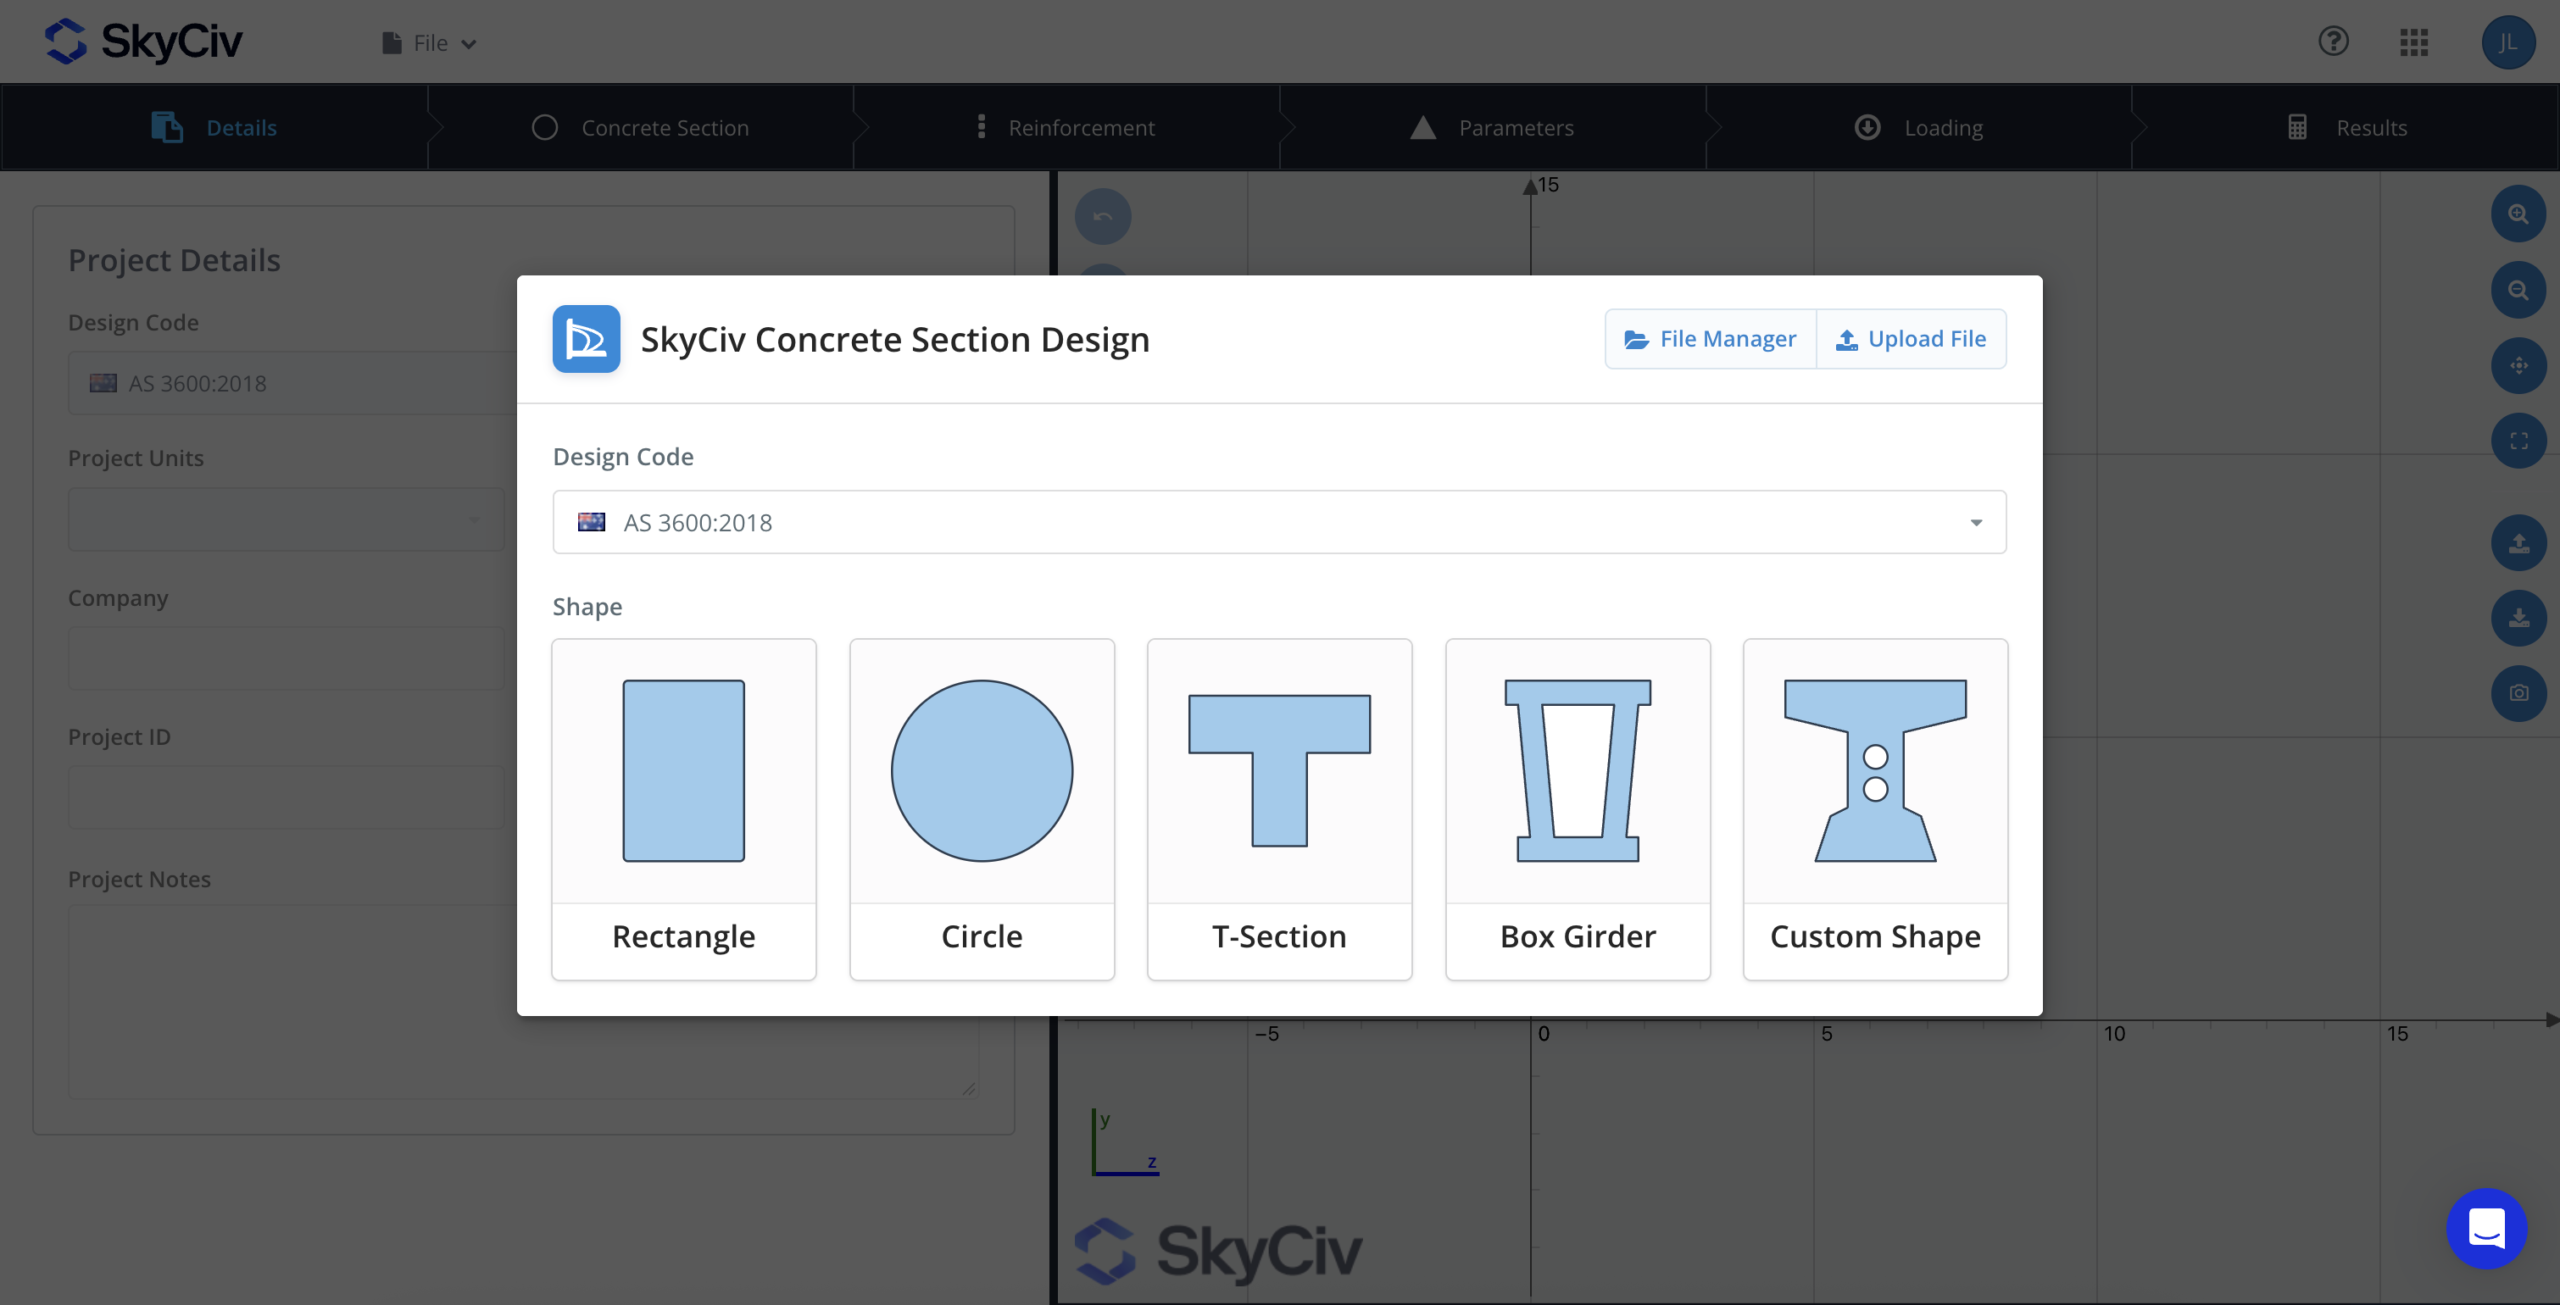
Every session opens with a startup window with the following options:
- Pick a Design Code or proceed without for purely analytical results.
- Pick a Shape. You can select from several pre-defined shapes: Rectangle, Circle, T-Section or Box Girder. Or you can submit a Custom Shape by uploading a dwg of the outline, or using CloudCAD to draw a custom shape.
- Select File Manager to open a saved project, or Upload File to load a project JSON from your computer.
Workspace
- Step bar: Details, Concrete Section, Reinforcement, Parameters, Loading, Results. All tabs are open once the startup window closes, so you can jump between them freely.
- Left panel: the inputs for the current tab.
- Right panel: the shared section drawing. Drag the divider to resize the panels.
Drawing toolbar
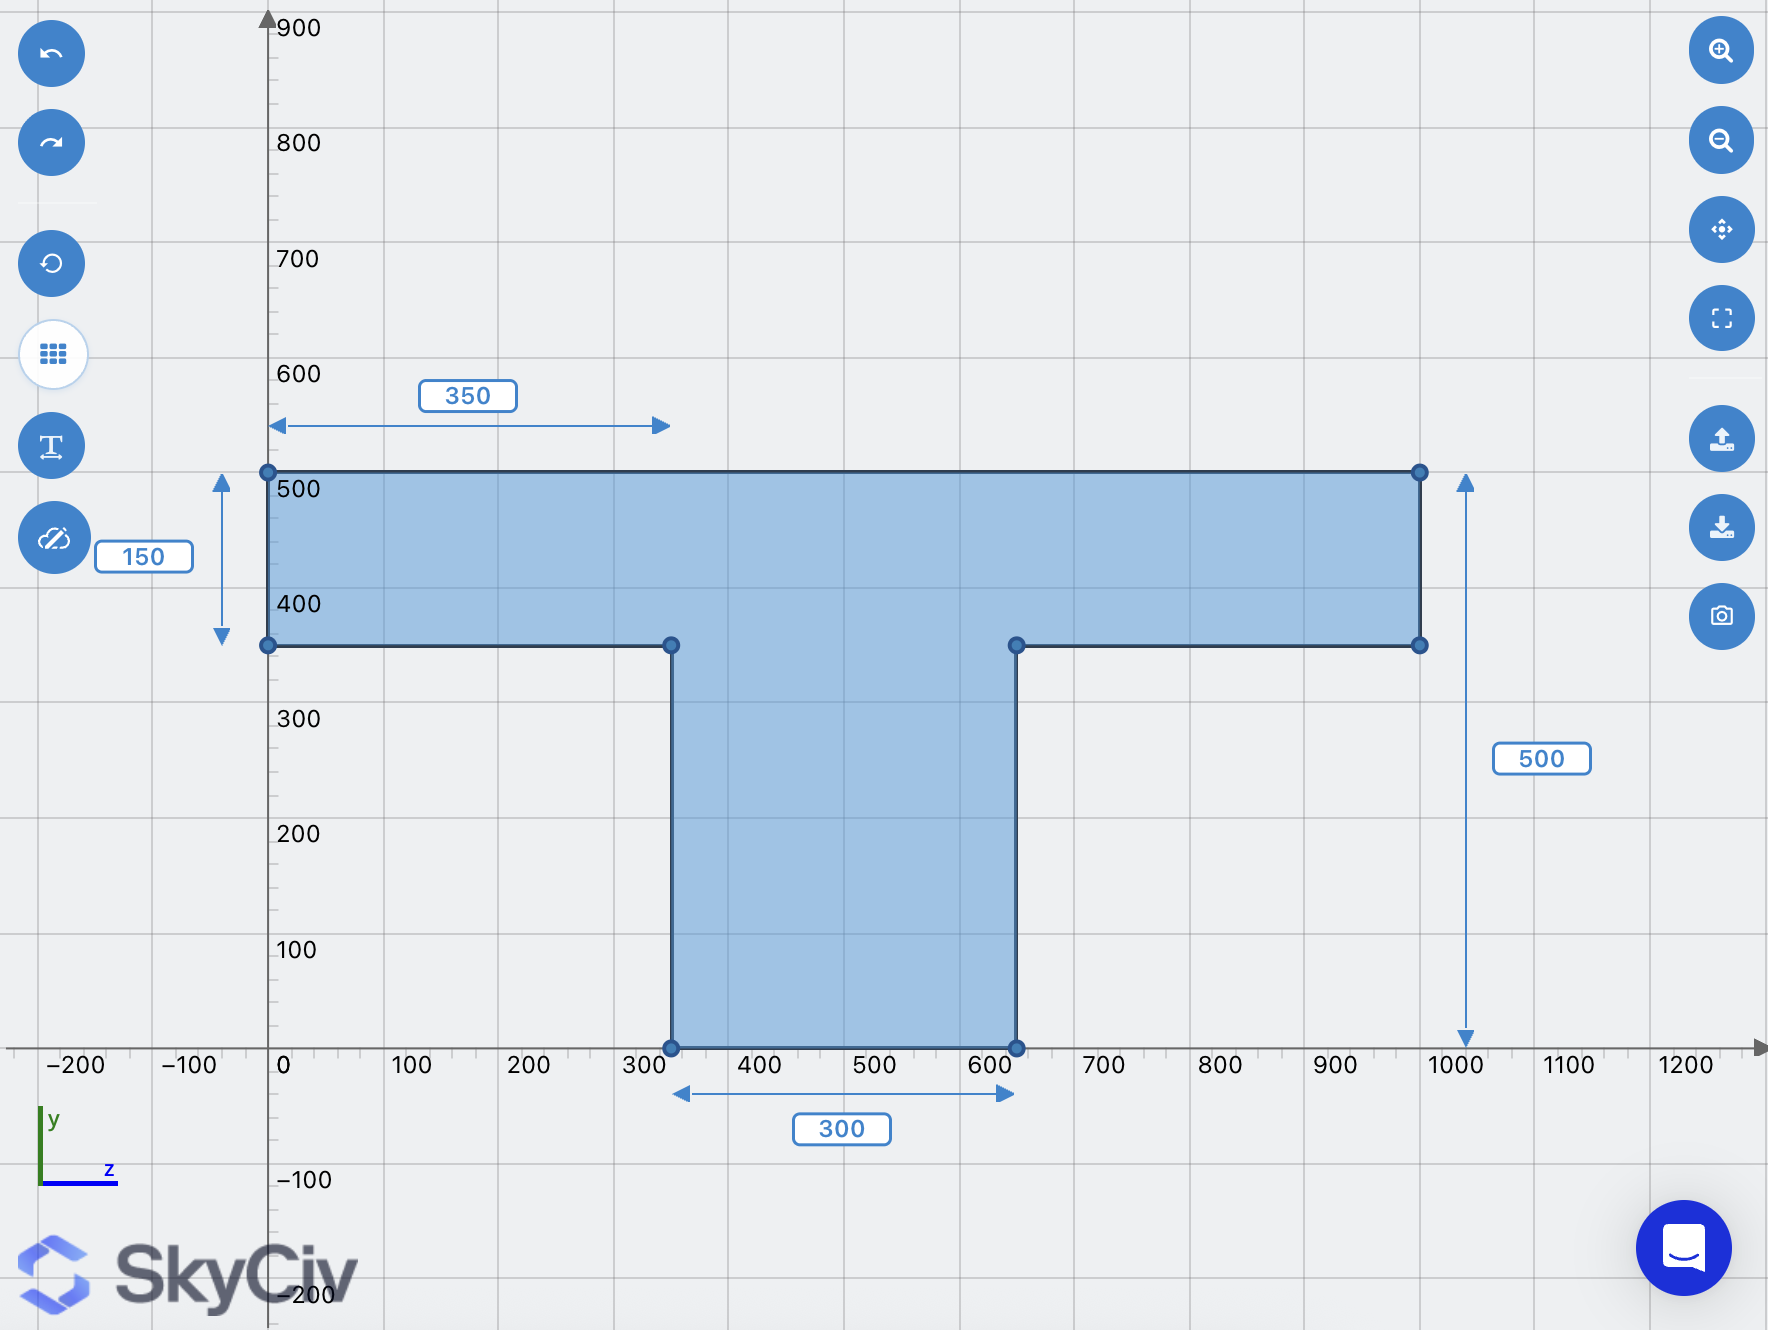
Scroll to zoom and drag to pan. Toolbar buttons sit on either side of the drawing:
| Button | What it does |
|---|---|
| Undo / Redo | Steps back or forward through section and bar edits, up to 50 steps. Shortcuts: Ctrl/Cmd+Z and Ctrl/Cmd+Y. |
| Clear | Resets bars, loads and results, and puts the shape back to its default size, after you confirm |
| Display mesh | Shows the analysis mesh (available once a mesh exists) |
| Show / Hide dimension | Turns dimension lines on or off |
| Export to Cloud CAD | Opens the section in SkyCiv CAD (allow pop-ups) |
| Zoom in / Zoom out / Reset View / Fit View | View controls |
| Export to DXF file | Downloads the outline (SECTION layer) and bars (REBAR layer) as a DXF |
| Export to PNG | Downloads an image of the section |
File menu
In the standalone app, the File menu has New, Open, Report Manager, Manage Previous Versions, Save, Save As, Share, Import File and Export File. The “Saving, files and integrations” section below covers these.
Details, design code and units
Choose the design code first, because it sets the units, the material database and the solver method. See the reinforced concrete design codes SkyCiv supports.
| Design code | Units |
|---|---|
| AS 3600:2018 | Metric only |
| EN 1992-1-1:2004 | Metric only |
| ACI 318-19 | Imperial (default) or Metric |
| CSA A23.3-04 | Metric only |
| NSCP 2015 | Metric only |
| IS 456-2000 | Metric only |
| No code | Metric only |
Metric works in mm, kN, kNm and MPa. Imperial works in in, kip, kip-ft and psi.
- Changing the design code or units in the Details tab clears the section, mesh, bars, loads, parameters and results, without asking first. Set them before you build the section.
The Details tab also holds the project information printed on the report: Company, Project ID, Project Name, Designer, Client and Project Notes.
Defining the section shape
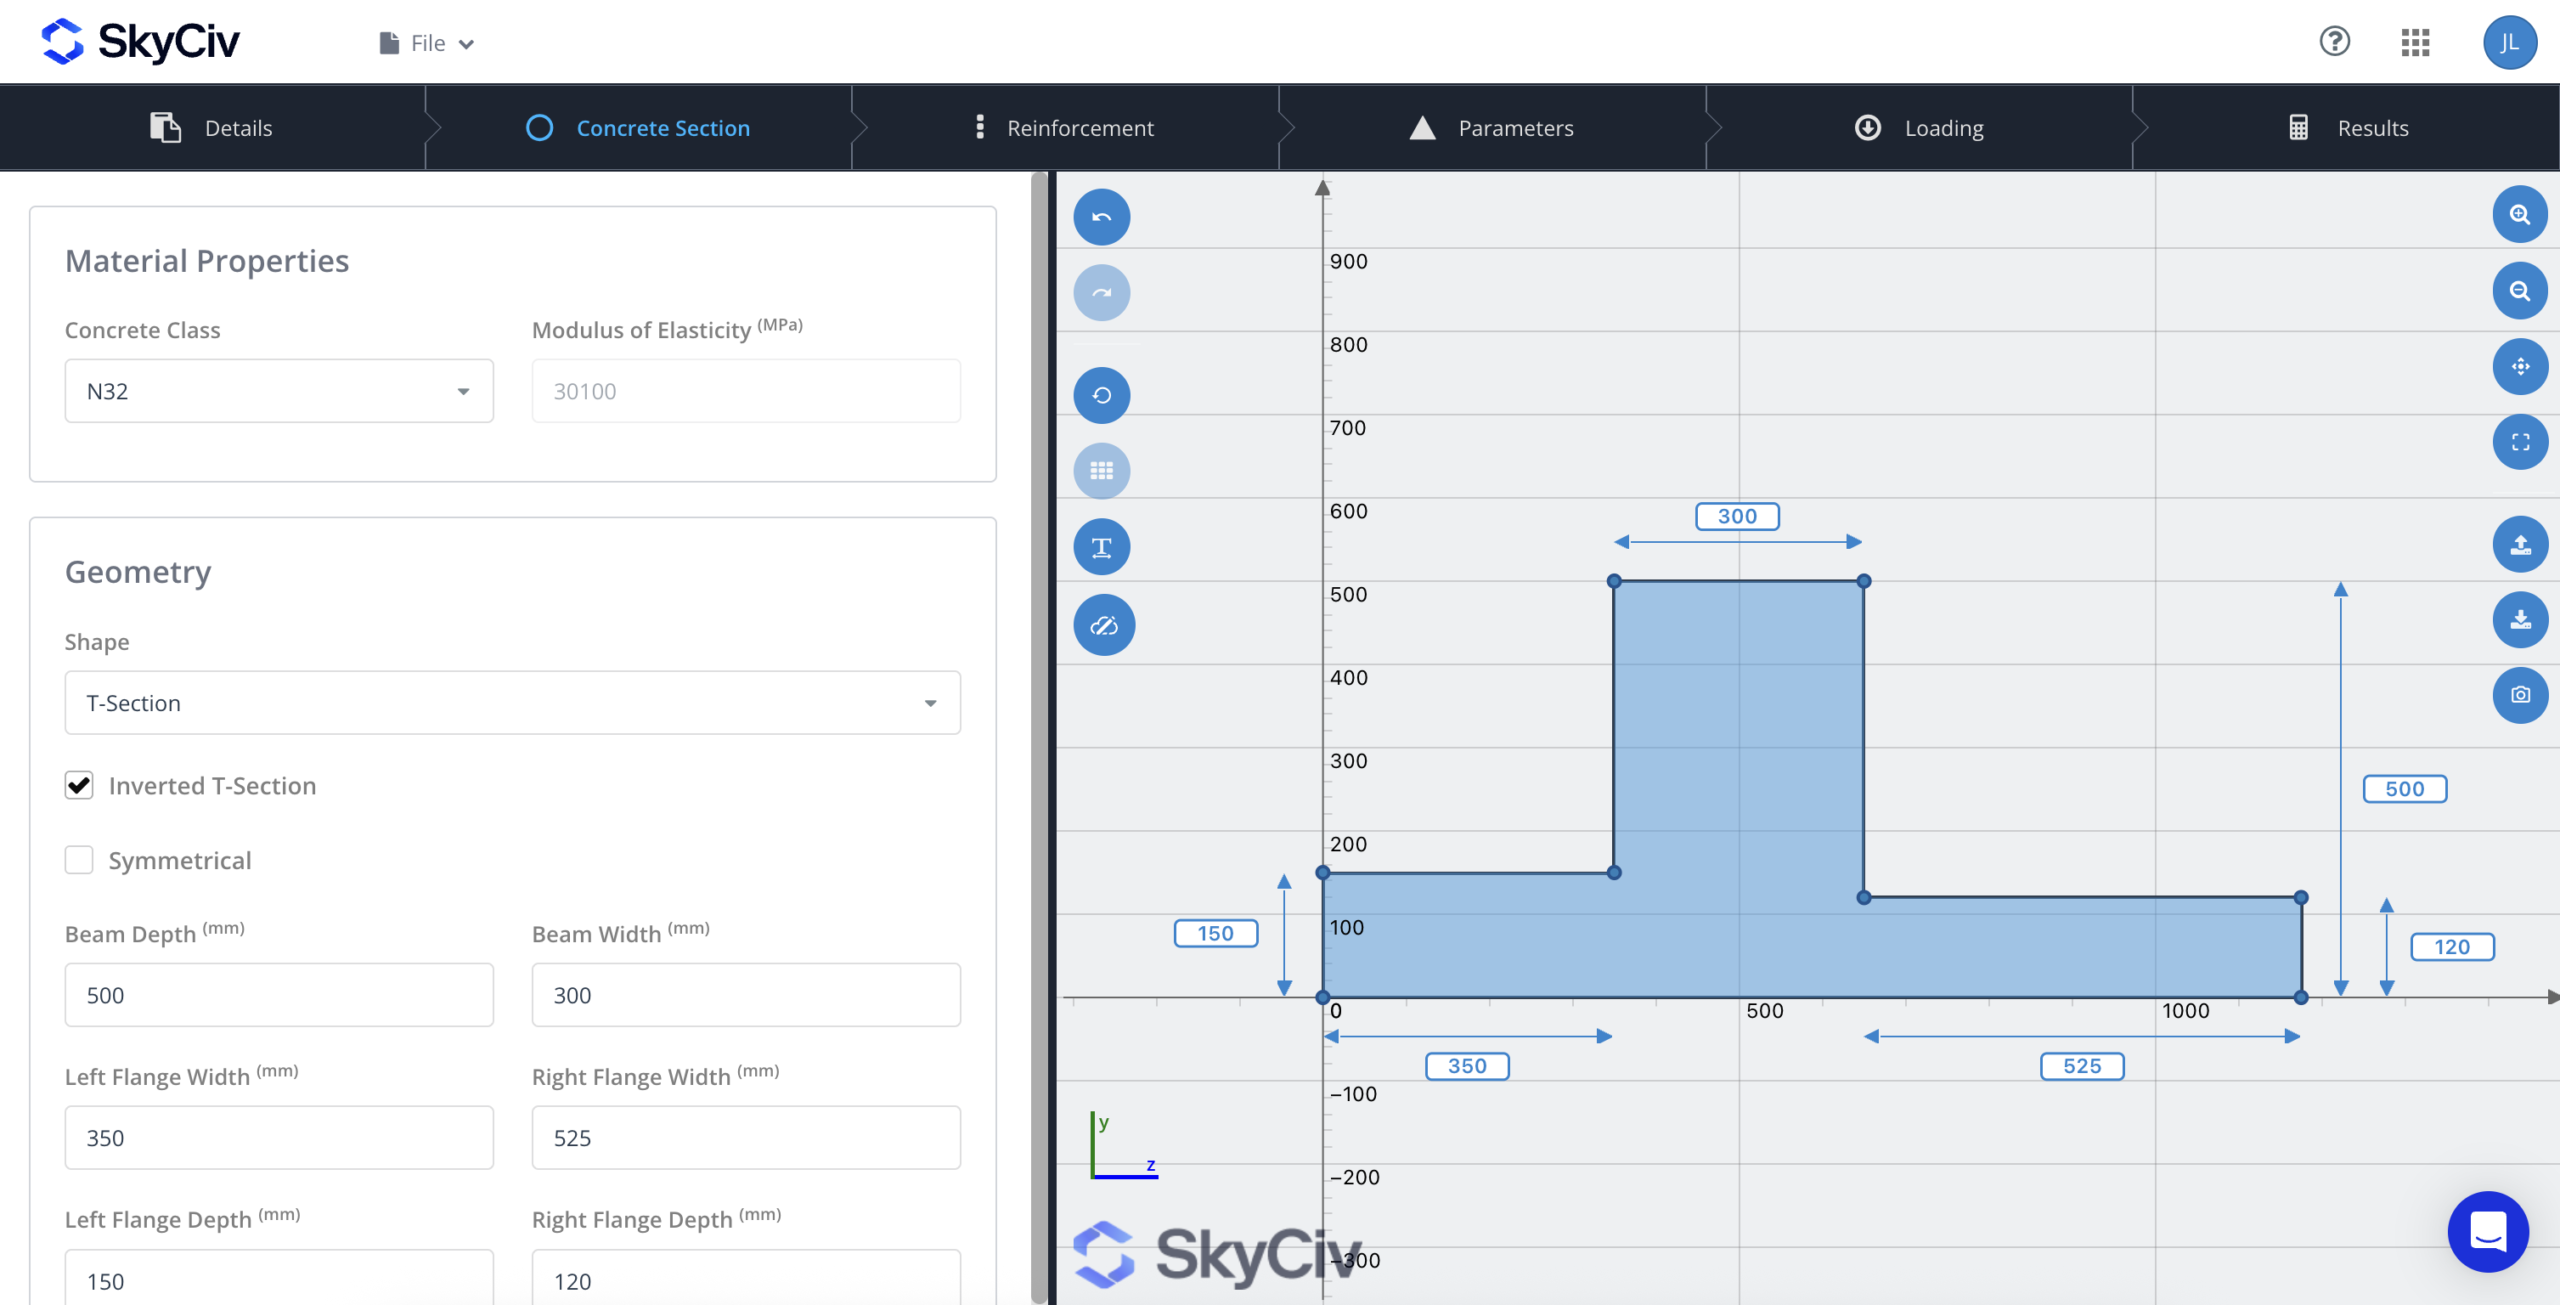
T-Section options:
- Inverted T-Section flips the flange to the bottom.
- Symmetrical is on by default. Turn it off to set left and right flange widths and depths separately.
The box girder is drawn as an outer outline with an inner void.
How inputs behave
- Spinner arrows step by 25 mm, or 0.1 in in imperial.
- The drawing redraws a moment after you stop typing.
- A blank, zero or negative entry falls back to the default.
- Changing the shape clears all reinforcement.
Custom shapes
Choosing Custom Shape opens SkyCiv CAD (platform.skyciv.com/cad), where you draw the outline. The profile comes back as an outer loop plus any inner loops, which become holes; each loop needs at least three points. On a custom shape, the dimension button becomes Inspect dimensions. Click any edge to show its length.
Concrete material
The Material Properties box on this tab sets the concrete grade. The next step covers materials.
Materials and parameters
You pick grades from the design code’s database: concrete on the Concrete Section tab, steel on the Reinforcement tab. Then fine-tune their stress-strain curves and the mesh on the Parameters tab. The modulus of elasticity fills in from the grade and is greyed out. With No code, there is a single Custom grade and you type the modulus yourself.
Database grades
| Code | Concrete grades | Reinforcement grades (fy) |
|---|---|---|
| AS 3600 | N20, N25, N32 (default), N40, N50, N65, N80, N100, N120 | R250N (250 MPa), D500N (500 MPa, default), D500L (500 MPa) |
| EN 1992 | C12/15 to C90/105 (13 grades) | Class A (400 MPa), B (500 MPa), C (600 MPa) |
| ACI 318 | C2500 to C10000 (11 grades) | Grade 40, 50, 60, 75 |
| CSA A23.3 | C25, C30, C35, C40, C45, C50 | 300R, 400R/W, 500R/W |
| NSCP 2015 | C3000 to C6000 (6 grades) | Grade 230, 275, 415 |
| IS 456 | M15 to M60 (10 grades) | Grade 250, 460, 500 |
| No code | Custom | Custom |
Parameters tab
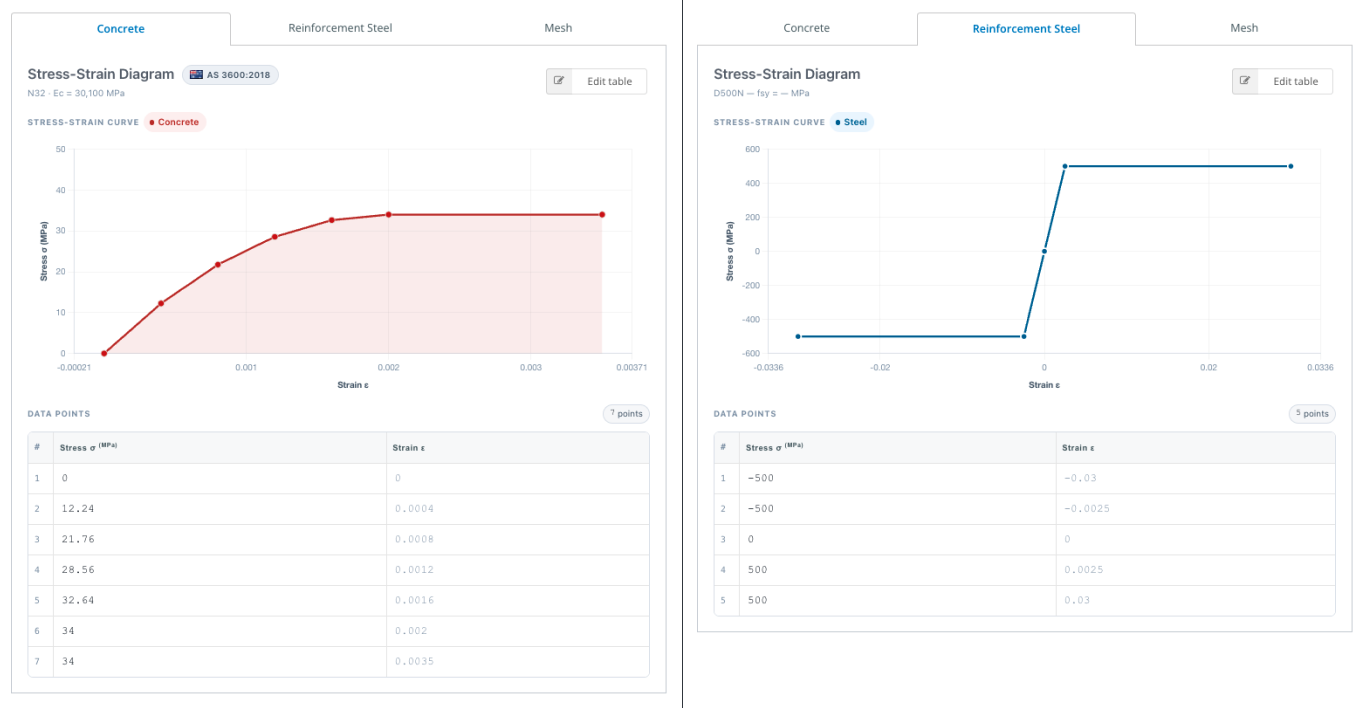
The Parameters tab has three sub-tabs: Concrete, Reinforcement Steel and Mesh.
- Concrete and Reinforcement Steel each show the active grade, its modulus, a stress-strain chart and the table of points behind it.
- To make a custom material, select Edit table, change any stress or strain value, add rows with Add row or delete rows (at least two must stay), then Save. The chart updates to match.
- Mesh sets Mesh Granularity from 1 (Very Coarse) to 7 (Very Fine); the default is 2. Generate Mesh builds the mesh, and the Display mesh button on the drawing shows it as a white wireframe. Finer meshes are more accurate but slower, and a very fine mesh can make the solver time out.
Changing the shape or any dimension throws away the mesh, which is rebuilt on the next run.
Reinforcement
You place bars on the Reinforcement tab, either as groups (patterns generated from a few inputs) or as individual bars typed in by coordinate. Bar positions use the section’s Z (horizontal) and Y (vertical) axes. Start by choosing the Reinforcement Grade.
Bar groups
Select New and pick a group type:
| Group | Places bars | Inputs |
|---|---|---|
| Linear | Evenly along a straight line | Start Z, Y; End Z, Y; bar size; Number of Bars |
| Rectangular | Around the perimeter of a rectangle | Corner Z, Y points; bars along Z and along Y (minimum 2 each); bar size |
| Circular | On a circle | Centre Z, Y; Pattern Radius; Number of Bars (minimum 3); bar size |
| Offset | Parallel to an edge you click | Offset Value; End Distance 1 and 2; bar size; Number of Bars |
Offset groups suit T-sections, box girders and custom shapes:
- Choose Offset and click an edge of the section. It turns orange. On a circular section the whole circle is selected.
- Set Offset Value: the distance from that edge to the bar centrelines.
- Set End Distance 1 and 2: the distance from each end of the edge to the end bar centres. Enter one and it copies to the other. If both together exceed the edge length, they are reduced to fit.
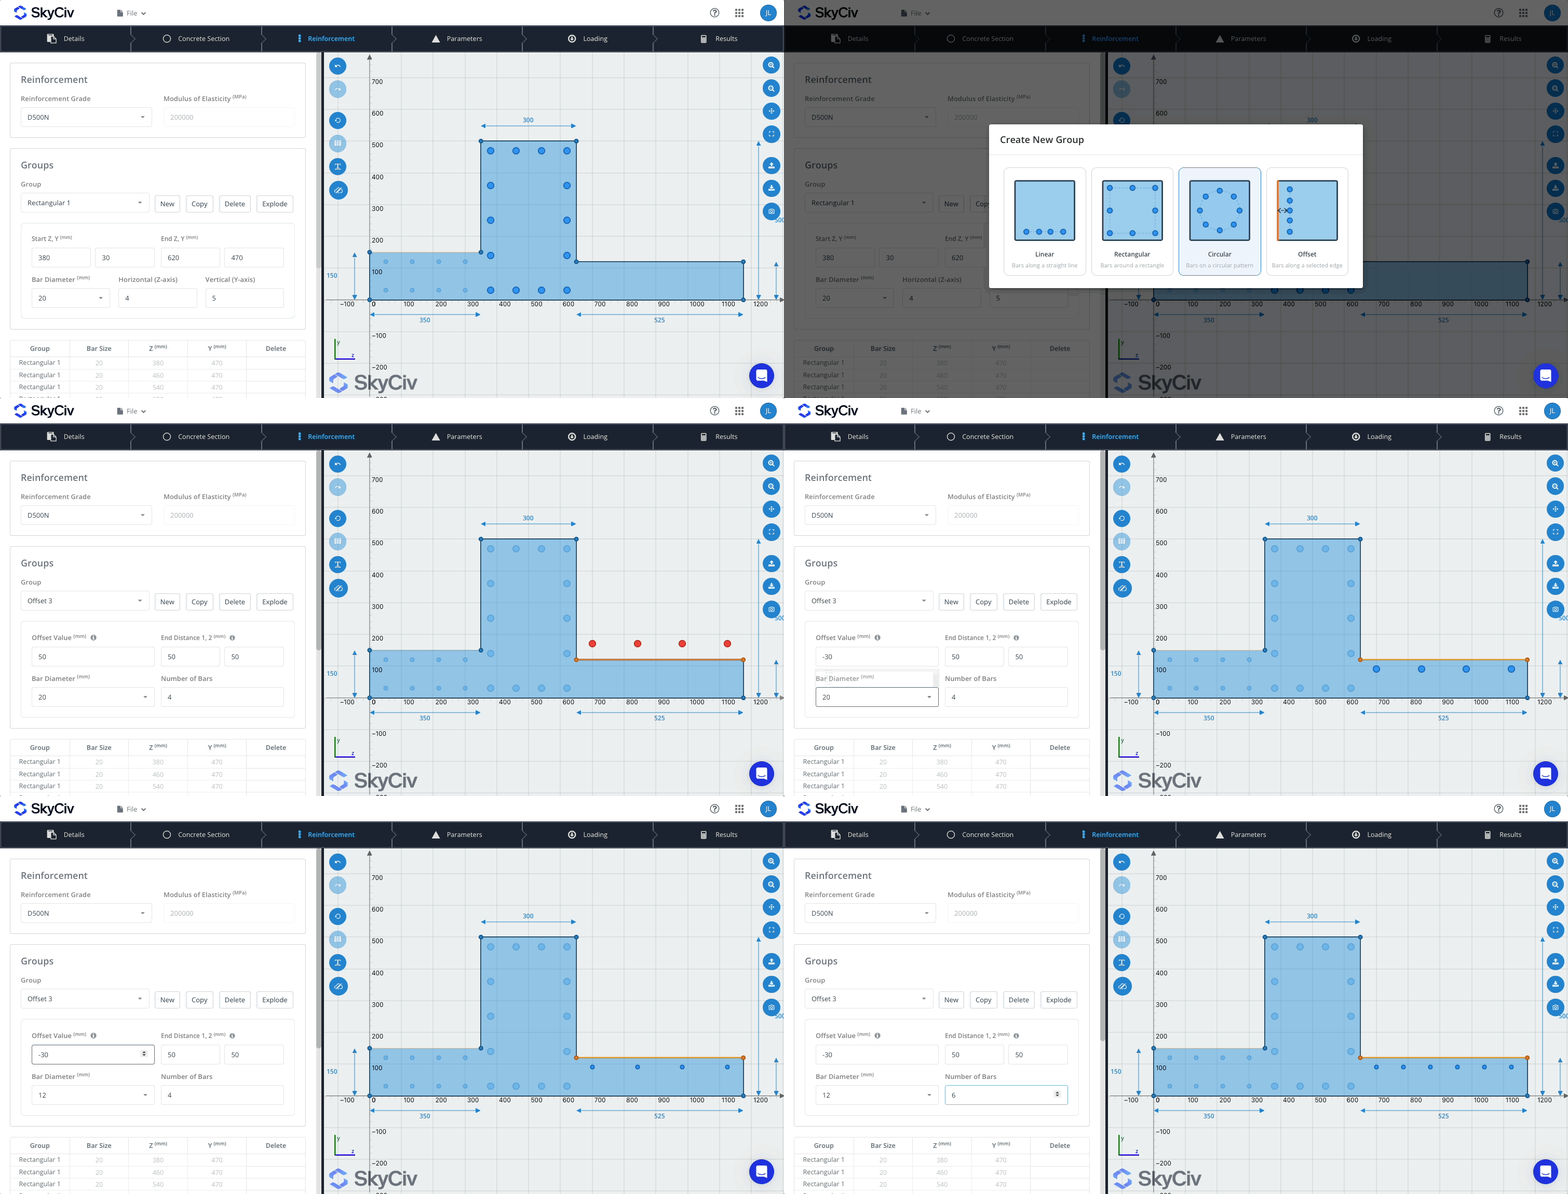
Groups are named automatically (Linear 1, Offset 2 and so on). Pick one from the Group dropdown to edit it; the other groups fade to 30% so the active one stands out. Choose None to see all groups at full strength.
- Copy duplicates the group in the same position, ready to edit.
- Delete removes the group and all its bars, after you confirm.
- Explode turns a group into individual bars you can edit one by one. This cannot be undone.
Individual bars
Select Add Row to add one bar to the bars table, then type its size, Z and Y. The table lists every bar (Group, size, Z, Y). Bars that belong to a group are read-only in the table; edit the group instead, or explode it.
Bar sizes
| Code | Sizes offered | Default |
|---|---|---|
| AS 3600 | 10, 12, 16, 20, 24, 28, 32, 36, 40 mm (N10 style also accepted) | 20 |
| EN 1992 | 6, 8, 10, 12, 14, 16, 18, 20, 25, 32, 40 mm | — |
| ACI 318 | #2 to #11, #14, #18 | #8 |
| CSA A23.3 | 10M to 55M | 20M |
| NSCP 2015, IS 456, No code | Any diameter, typed in | 20 mm (1 in) |
Each dropdown also has a Custom entry for typing your own diameter.
Checking bar placement on the drawing
- Hover a bar to see its diameter and (z, y) position.
- A bar turns red, tagged [OUTSIDE] or [CLASH], if any part sits outside the concrete or in a void, or if it overlaps another bar.
- Click a bar to select it (orange) and highlight its table row, or click a row to find the bar.
- Bars cannot be dragged; move them by changing their inputs.
Invalid group inputs, such as fewer than 2 bars per side or a radius of zero, are ignored without a warning. If a pattern doesn’t change, check the values are within range.
Loading
The Loading tab, titled Section Forces, takes one set of design actions: an axial load and moments about two axes. At least one value must be non-zero before you can calculate.
| Field | Metric unit | Metric default | Imperial default | Sign convention |
|---|---|---|---|---|
| Axial Load | kN | 1000 | 200 | Positive is compression |
| Bending Moment About Z-Axis (Mz) | kNm | 100 | 75 | Positive puts the bottom of the section in tension |
| Bending Moment About Y-Axis (My) | kNm | 0 | 0 | Positive puts the left of the section in tension |
Setting both moments checks biaxial bending. The app checks one load set at a time and labels it Load Group 1 in the results. Shear and torsion are not part of the check.
Running the analysis and reading results
Open the Results tab and select Calculate Results. The app first checks your inputs, then sends the section to the SkyCiv solver. A progress card shows each step and the seconds elapsed. Requests time out after 90 seconds.
Design checks (left panel)
When the run finishes, a Design Completed banner appears above three Design Checks rows: Axial Force N, Bending Moment Mz and Bending Moment My. Each row shows demand / capacity with units and a utilisation percentage.
| Icon | Ratio | Meaning |
|---|---|---|
| Green check | Below 0.95 | Passes with margin |
| Yellow exclamation | 0.95 to 1.0 | Passes, close to the limit |
| Red cross | Above 1.0 | Fails |
| Grey dash | Capacity rounds to zero | Not applicable |
Pass or fail is shown by the icon and colour only; there is no separate PASS/FAIL label.
If you change any input after a run, the panel greys out and shows Results Need Updating. Select Run Design Checks or Recalculate to refresh. Each diagram tab also shows Result out of date until you recalculate.
Result tabs (right panel)
| Tab | What it shows | Controls |
|---|---|---|
| Section Stresses (default) | Concrete stress heat map (blue compression, red tension), each bar coloured and labelled by stress, and the neutral axis as a dash-dot line | Zoom, pan, Show Labels toggle, collapsible side panel |
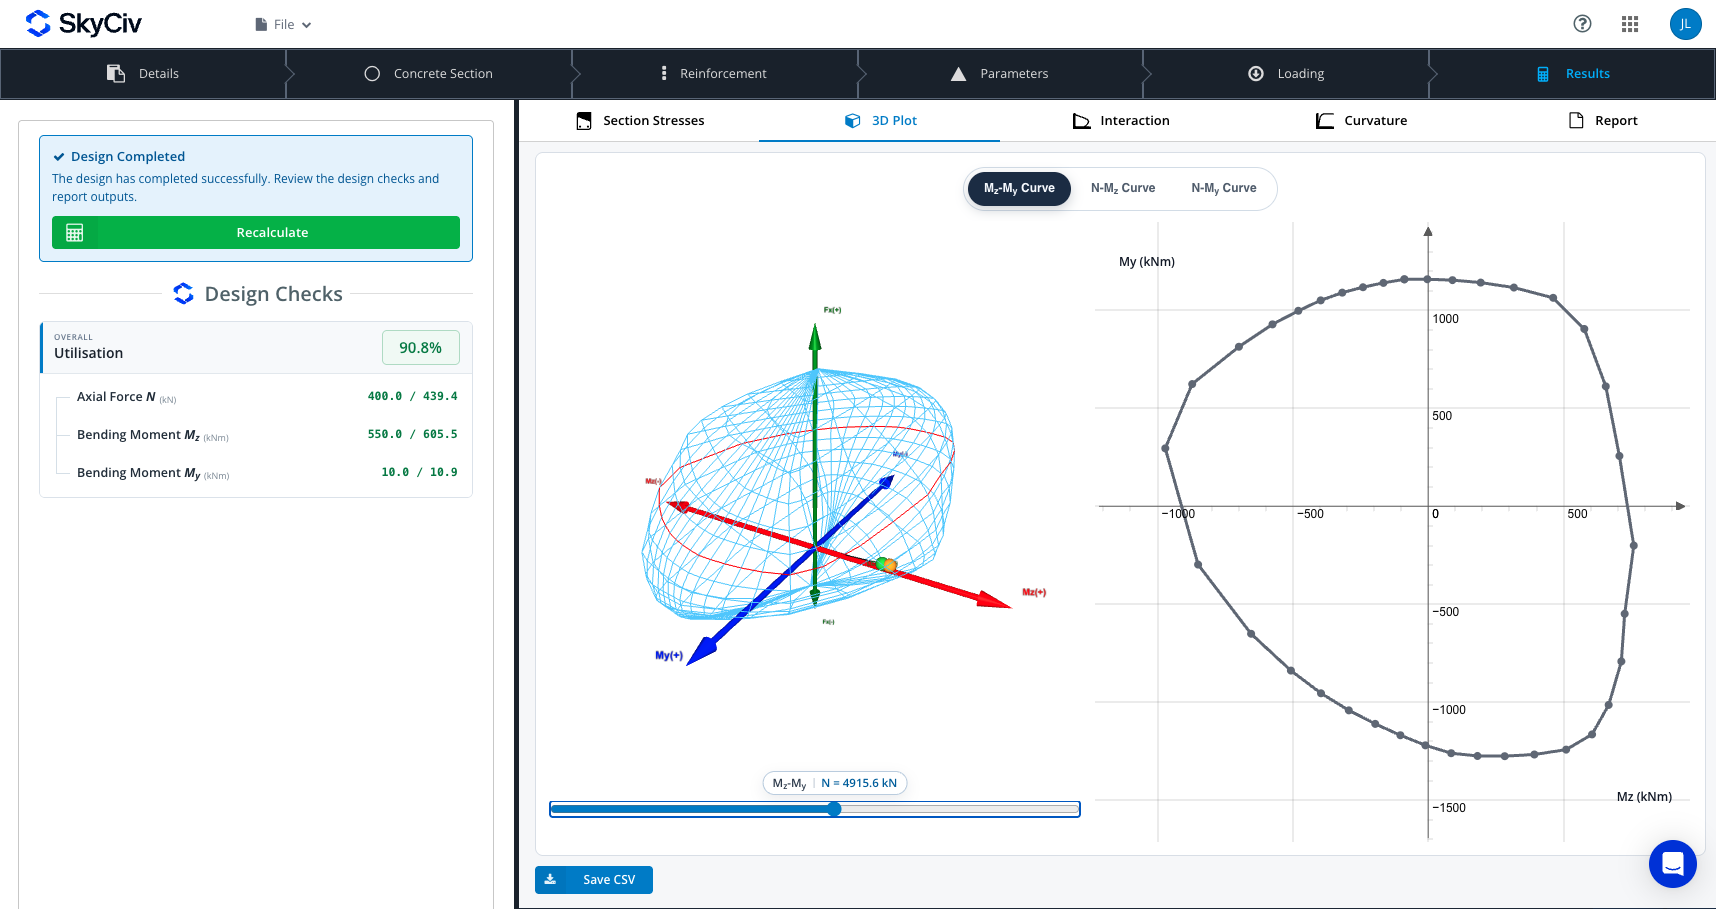
| 3D Plot | The 3D N–Mz–My interaction surface, with your load as a sphere labelled LC 1 (green if the ratio is under 1, red otherwise) and an orange limit point | Orbit; Mz-My Curve, N-Mz Curve, N-My Curve modes; a slider steps through slices (by N or by angle) with a 2D slice beside it |
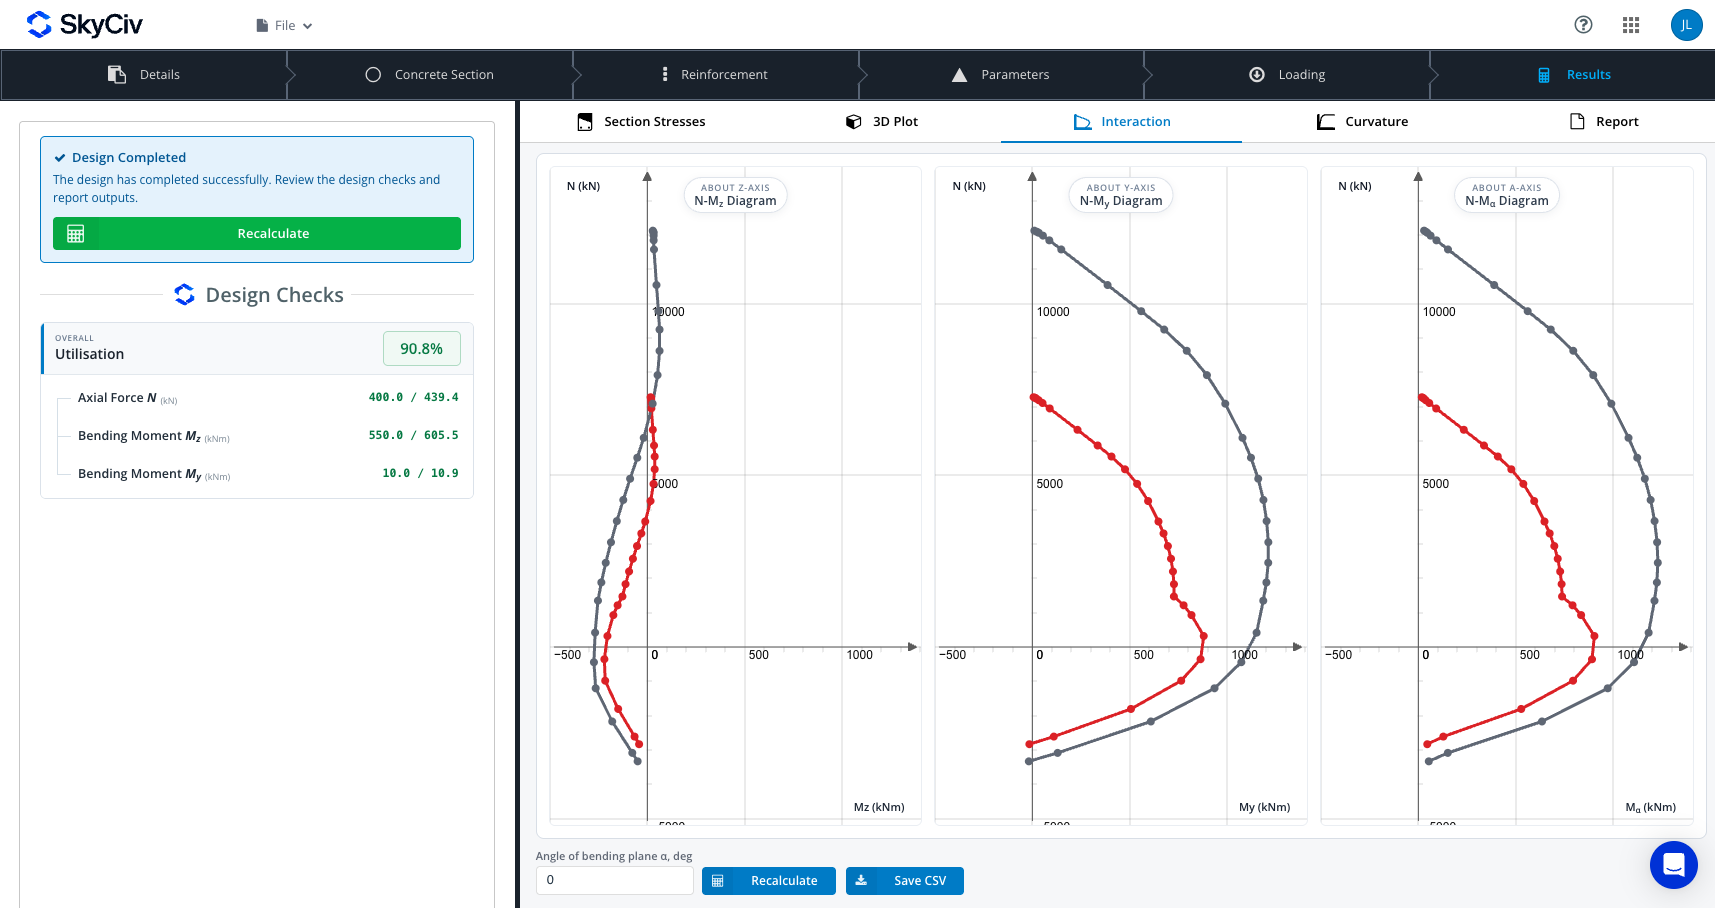
| Interaction | Three 2D diagrams: N–Mz, N–My and N–Mα, with the design curve in red and the nominal curve in grey | Angle of bending plane α (0–360°, default 90), Recalculate, hover for values |
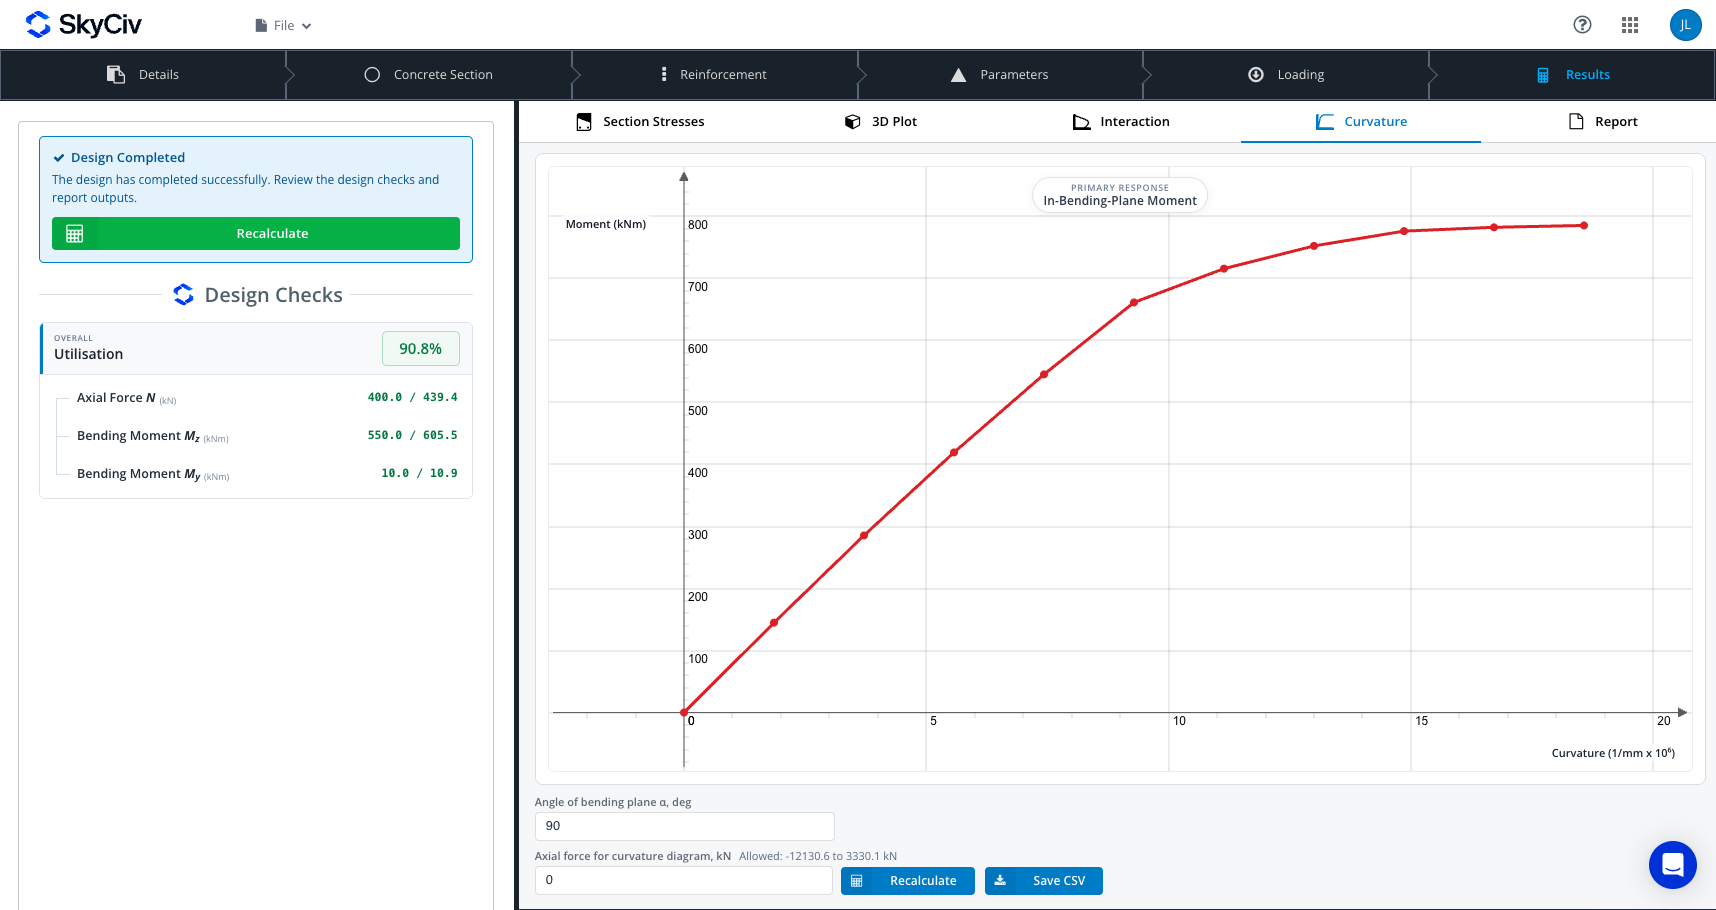
| Curvature | Moment-curvature diagram for the in-plane moment, curvature in 1/mm × 10⁶ against moment in kNm | Bending plane angle α and axial force; the allowed axial range is shown beside the input |
| Report | The full calculation report | See Reports and export |
The Section Stresses side panel lists, for Load Group 1:
- Forces: N, Mz and My.
- Concrete: maximum stress, maximum strain and the limit compressive strain.
- Reinforcement: maximum and minimum stress and strain, and limit compressive and tensile strains.
- Capacity Ratio to three decimals, coloured pass, warn or fail.
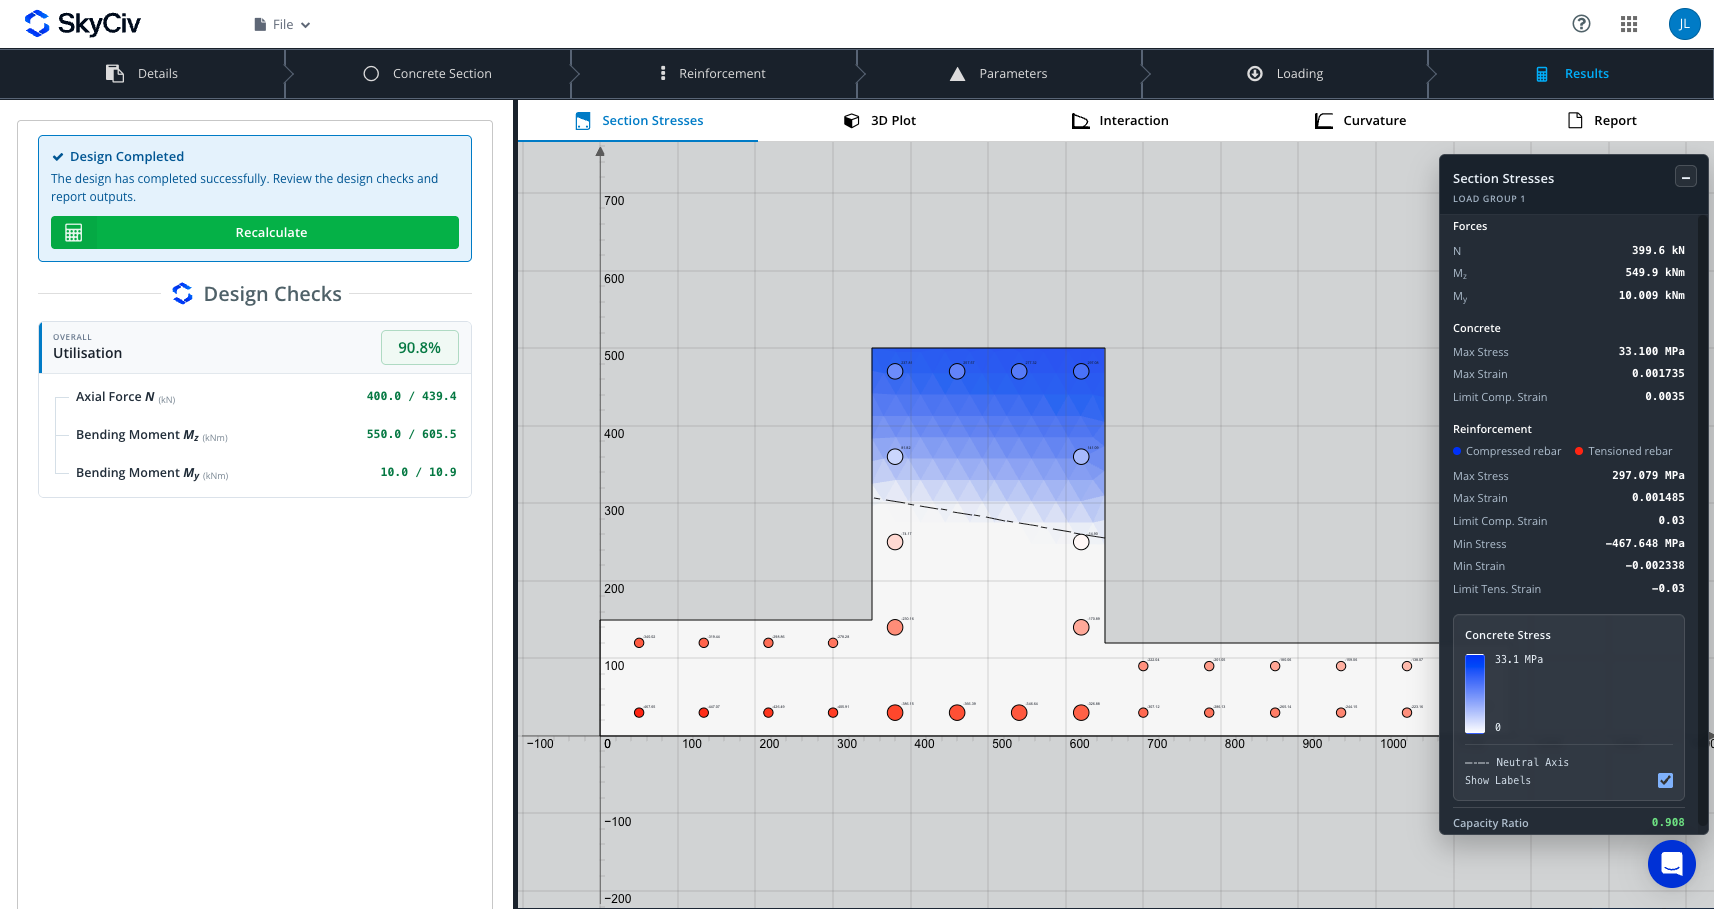
Stresses show in MPa, or ksi in imperial units. The curvature diagram only accepts an axial force inside the section’s axial capacity range.
Reports and export
The Report tab shows the solver’s full calculation report inside the app once a run succeeds. Three buttons sit above it:
- Open in new tab: opens the report in its own browser tab.
- Download HTML: saves the report as an HTML file.
- Download PDF: saves the report as a PDF.
The solver writes the report’s contents, and the Details tab supplies its project and engineer header. Before a run, the tab shows No Report Available.
The diagram tabs also have a Save CSV button:
| Tab | File | Columns |
|---|---|---|
| 3D Plot | 3d_nominal_diagram.csv | The slice currently selected |
| Interaction | interaction_diagrams.csv | N, M-alpha, Mz and My, for the design and nominal curves |
| Curvature | curvature_moment_diagrams.csv | Curvature, moment in and out of the bending plane |
CSV export is turned off while a diagram is loading, out of date or in error.
Saving, files and integrations
Projects are saved through the SkyCiv File Manager or as a local JSON file. Nothing saves automatically, so save before closing the tab.
| Action | Where | What happens |
|---|---|---|
| Save / Save As | File menu | Saves to your SkyCiv File Manager |
| Open | File menu, startup window (File Manager) or the New File chip | Opens a saved project |
| Export File | File menu | Downloads the whole project as project-data.json |
| Import File / Upload File | File menu or startup window | Loads a project JSON from your computer |
| New | File menu | Asks to confirm, then clears everything and reloads |
| Report Manager, Manage Previous Versions, Share | File menu | Standard SkyCiv file tools |
Pressing F5 or Ctrl/Cmd+R asks before clearing the project, and closing the tab triggers the browser’s leave-page warning.
Importing from S3D or CloudCAD
A section can open pre-filled from SkyCiv Structural 3D (S3D) or CloudCAD. The import fills in project details, material, geometry and loads (N, Mz, My). Imported sections are marked Populated from S3D (or CloudCAD), and a notice lists what came across. A CloudCAD import picks the design code from your country, or ACI for imperial users.
Exporting
Besides the report and CSV files (see Reports and export), the drawing toolbar exports the section to DXF, PNG or SkyCiv CAD.
Tips, limitations and troubleshooting
Work in this order
- Set the design code and units before anything else, because changing them later clears the project.
- Finish the shape before adding bars, because changing the shape clears the bars.
- Check that no bar is red before you calculate.
- Save, or Export File, before closing the tab.
Common messages
| Message | Cause | Fix |
|---|---|---|
| Some inputs need attention | A shape, bar or load is missing | Read the listed items; for example, add at least one bar or enter a non-zero load |
| Results Need Updating / Result out of date | Inputs changed after the last run | Select Run Design Checks or Recalculate |
| Solver timed out / Request timed out after 90 s | The mesh is too fine for the section | Lower Mesh Granularity on the Parameters tab and run again |
| Curvature diagram could not be created for this axial force | The axial force is outside the section’s capacity range | Enter a value within the allowed range shown beside the input |
| Please allow pop-ups to export the board to Cloud CAD | The browser blocked the CAD window | Allow pop-ups for SkyCiv |
| Calculation service not loaded | The page did not finish loading | Refresh the page |

