Reinforced Concrete Column Design Calculator
The SkyCiv Reinforced Concrete Column Calculator allows engineers to complete Reinforced Concrete Column Design for circular and rectangular concrete columns to ACI, European, New Zealand and Australian Standards.
Reinforced concrete columns are a composite section that combine the benefits of concrete and steel in an economic way. The composite nature of a reinforced concrete column makes design calculations more rigorous than other sections and the free SkyCiv Quick Design Concrete Column Calculator provides an easy tool for engineers to assess capacities and generate interaction diagrams to the following standards:
- United States - ACI-318-19: Building Code Requirements for Structural Concrete.
- Australian Standards - AS 3600-2018: Concrete Structures, Steel & Tendons.
- Canadian Standards - CSA A23.3:24 Concrete Column Design
- European Standards - Eurocode 2: Design of Concrete Structures (EN 1992-1-1:2004).
- New Zealand Standards - NZS 3101:2006: The design of concrete structures
You can switch between these standards in the top right of the concrete calculator using the flag icon found at the top of the left side input panel. To run the calculator, press the run button at the top right of the software.
About Concrete Column Design
What Are Columns?
Columns are vertical members within a building and are key to allowing the load in a building to travel down to its foundation. As vertical members, they primarily deal with large compression loads due to gravity forces but naturally due to eccentricities in loading and lateral forces such as wind and earthquake loads they are also required to resist bending moments. Columns are quite similar to piles except that piles have soil to help restrain against buckling and may resolve forces along the shaft of the pile where as a column resists forces at its base. Piles almost always have a circular section however concrete columns commonly have circular or rectangular cross sections.
Why Use Concrete Columns?
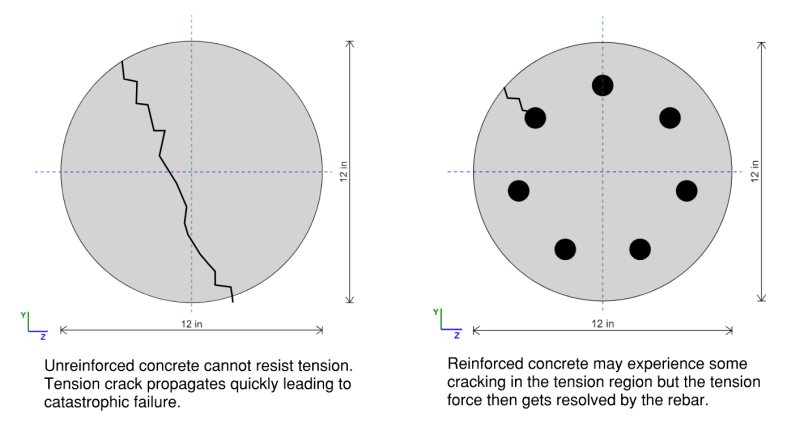
Columns are exposed to large compression forces which naturally makes us want to use concrete, a very economical solution for dealing with compression loads. Unfortunately, plain concrete is brittle and weak in tension and bending make it unsafe to use without steel reinforcement bars (rebar).
Reinforced concrete columns utilise the compression strength of concrete and tension strength of rebar for an economic column design. Concrete columns are widely used in construction due to their durability, fire resistance, and ability to support heavy loads.
How To Design For Reinforced Concrete Columns
The composite nature of a reinforced column makes it more difficult to analyse from first principles. With steel we are able to simply calculate the section modulus and multiply that by the yield strength to find a bending capacity. With reinforced concrete the section is not homogeneous and with two different materials we need to look into the stress-strain graph to really see what is happening and how our section might fail.
This becomes more difficult when we consider that columns almost always have bending and compression forces acting simultaneously which affects the capacity of the column. A tool to help with such a design is what is known as an interaction diagram.
Reinforced Concrete Column Design Standards
EN 1992-1-1:2004 Concrete Column Design
To switch to the EN 1992-1-1:2004 Concrete Column Quick Design tool use the Flag toggle in the top left of the input tab. The EN 1992-1-1:2004 tool allows is for the design reinforced non-prestressed concrete columns as per EN 1992-1-1:2004, Eurocode 2: Design of concrete structures. It completes the following column design checks:
- Design Moments: The moments used to design a concrete column depend on the slenderness of the column in the considered axis. If the column is not slender (or 'stocky'), then the column only needs to be checked for first order moments. The column must be designed for second order moments for each axis about which it is slender. Users have the option to directly provide second-order moments to be used in the calculation. This option is only available if the column is slender.
- Bending Capacity: The bending moment capacity is calculated in each axis by plotting the coordinates of the design forces (axial load and bending moment) on the interaction diagrams. A line is drawn parallel to the x-axis, which intersects this coordinate (N = design axial load). The moment capacity is taken at the point where this line intersects the interaction line.
- Shear Capacity: The applied shear force is initially checked against the shear capacity of the concrete only. If the resistance exceeds the applied shear, then the capacity of the section is taken as that of the concrete, VRd = VRd,c. If the applied shear is greater than the capacity of the concrete, then the resistance of the section is taken as the minimum of the shear reinforcement capacity and the crushing strength of the inclined concrete strut, VRd = min[ VRd,max; VRd,s ]. The values for VRd,c, VRd,max and VRd,s are calculated using the equations set out in En 1992-1-1:2004 for rectangular sections. The equations for circular columns are taken from "Shear design of circular concrete sections using the Eurocode 2 truss model". For both shapes, the upper and lower bound value for the concrete strut capacity, (VRd,max) are determined for cotθ = 1 and cotθ = 2.5 respectively. If the applied shear force VEd is greater than the upper bound value, then cotθ = 2.5 is used to define the strut angle. If the shear force is less than the lower bound, cotθ = 1 is used. When VEd is between these two values, the design angle of θ is iteratively increased until VRd,max > VEd. This angle is used in the rest of the calculation.
- Effects Of Creep: Users have several options for defining the effects of creep on the column they are designing. If the column is non-slender, then default values may be used in the calculations. This will set the value of 'A' to 0.7 in Eq 5.13N for the slenderness limit. There are no default values specified for the creep factor used to calculate curvature (Kφ) in EN 1992-1-1: 2004. If the column is determined to be slender, the user must input their own value or provide sufficient data to calculate the effective creep ratio φef.
Full EN 1992-1-1 Concrete Column Design Documentation | EN 1992-1-1 Concrete Column Design Example Report
AS 3600:2018 Concrete Column Design
To switch to the AS 3600:2018 Concrete Column Quick Design tool use the Flag toggle in the top left of the Quick Design input. The AS 3600:2018 tool allows is for the design of reinforced non-prestressed concrete columns as per AS 3600:2018. It completes the following checks:
- Axial Capacity: The ultimate compression strength of a column is defined as it's squash load (Nuo). This is calculated assuming the section's reinforcement has reached it's full yield stress (fsy) in compression and the concrete is under a uniform compressive stress of α1f'c (10.6.2.2). The tensile capacity of the section is calculated as the strength of the reinforcement and ignores any contribution from the concrete.
- Design Moments: The moments used to design a concrete column depend on the slenderness of the column in the considered axis. If the column is not slender (or 'short'), then the column only needs to be checked for first order moments. The column must be designed for second order moments for each axis about which it is slender.
- Bending Capacity: The bending moment capacity is calculated in each axis by plotting the coordinates of the design forces (axial load and bending moment) on the interaction diagrams. A line is drawn parallel to the x-axis, which intersects this coordinate (N = design axial load). The moment capacity is taken at the point where this line intersects the interaction line.
- Shear Capacity: The total shear capacity of the column is calculated as the capacity of the concrete combined with the capacity of the shear reinforcement. This value is limited to the crushing strength of the shear web.
- Biaxial Shear Capacity:This calculator includes a value for 'Biaxial Shear', which is calculated as the resultant of the mono-axial shear utilisations in the 'Y' and 'Z' axes. AS3600 does not provide specific guidance on how to consider a concrete section for biaxial shear, so this value is provided as a conservative safeguard.
Full AS 3600:2018 Concrete Column Design Documentation | AS 3600:2018 Concrete Column Design Example Report
NZS 3101:2006 Concrete Column Design
To switch to the NZS 3101:2006 Concrete Column Quick Design tool use the Flag toggle in the top left of the Quick Design input. The NZS 3101:2006 version completes the following checks:
- Axial Capacity: The ultimate compression strength of a column is defined as 0.85.φ.Nn,max. This is calculated as per equation 10-10. The tensile capacity of the section is calculated as the strength of the reinforcement and ignores any contribution from the concrete.
- Design Moments: The moments used to design a concrete column depend on the slenderness of the column in the considered axis. If the column is not slender (or 'short'), then the column only needs to be checked for first order moments. The column must be designed for second order moments for each axis about which it is slender. Users have the option to directly provide second-order moments to be used in the calculation.
- Bending Capacity: The bending moment capacity is calculated in each axis by plotting the coordinates of the design forces (axial load and bending moment) on the interaction diagrams. A line is drawn parallel to the x-axis (N = design axial load). The moment capacity is taken at the point where this line intersects the interaction line.
- Shear Capacity: The total shear capacity of the column is calculated as the capacity of the concrete, Vc, combined with the capacity of the shear reinforcement.
- Confinement and Anti-Buckling: This calculator checks that adequate confinement is provided to the core of the column and that the ties are sufficiently large to prevent buckling of the longitudinal reinforcement.
Full NZS 3101:2006 Concrete Design Documentation | NZS 3101:2006 Concrete Design Example Report
What Is An Interaction Diagram ?
An interaction diagram is a graphical representation of the strength capacity of a column under combined bending and axial loads.
The following sections of this article will describe how to calculate the interaction diagram for a reinforced column by hand. Following through with the principles to generate the interaction diagram will leave the reader with a better understanding of the key points in an interaction diagram and how to interpret the results of the interaction diagram for a concrete column design.
Generating an interaction diagram by hand for every column section can be time consuming so software like the skyciv concrete column calculator exists to automatically generate interaction diagrams for concrete columns and also assess the utilisation based on the design loads without requiring a user to manually check the interaction diagram.
How To Create An Interaction Diagram
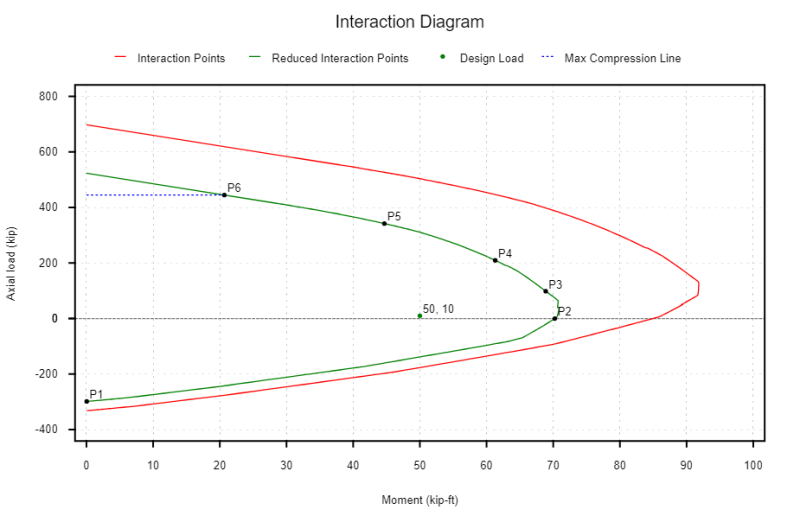
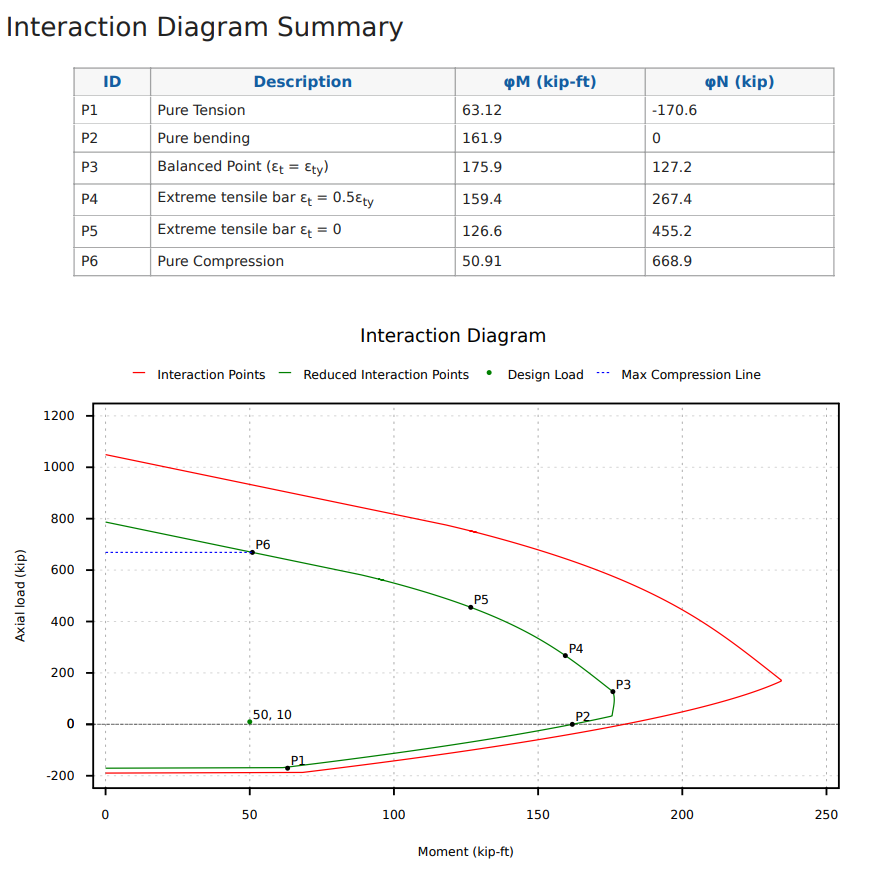
Creating an interaction diagram involves assessing the reinforced concrete column for the following cases:
- (P1) Pure Tension - This is the largest axial tension load that the column can support.
- (P2) Pure Bending - The section is subject to a bending moment M and axial force of P = 0
- (P3) Balanced Point (εt = εty) - A balanced condition is reached when failure of concrete occurs at the same time as the extreme tensile steel yields.
- (P4) Half-yield Point (εt = 0.5 εty) - This is an intermediate position to help with plotting an accurate interaction diagram.
- (P5) Decompression Point (εt = 0) - This case marks the position when tension lap splices are change to compression lap splices (ACI). Bars are transitioning between taking some tension forces to only taking compression forces.
- (P6) Pure Compression - This is the largest axial compression load that the column can support.
Our interaction diagram can also take into consideration the safety reduction factor required in our design. Something we may notice in the interaction diagram above is that we have a larger factor of safety in the compression controlled region (0.65 or 0.75) than we do in the tension controlled region (0.9).
Reduction Factors For Concrete Column Design According to ACI 318-19
The strength reduction factor (φ) used for the moment, axial force or combined moment and axial force is dependent on how the section is classified.
The section is classified in relation to the net tensile strain (εt) which is the strain in the reinforcement closest to the tension face:
- Tension Controlled : εt ≥ εty + 0.003
- Transition : εty < εt < εty + 0.003
- Compression Controlled εt <= εty
Because of the change in the strength reduction factor it may also be useful to hand calculate the compression control point (P3 in previous diagram) and the tension control point (εt ≥ εty + 0.003) not labelled.
It is also dependent on our transverse reinforcement. For spirals confirming to 25.7.3 we can get phi based on our εt as:
- Tension Controlled: φ = 0.9
- Compression Controlled: φ = 0.75
- Transition: φ = 0.75 + 0.15 (εt - εty ) / 0.003
For other types of transverse reinforcement:
- Tension Controlled - φ = 0.9
- Compression Controlled - φ = 0.65
- Transition = φ = 0.65 + 0.25 (εt - εty ) / 0.003
(In fact the transition formula is a simple linear function that depends on how close we are to the compression or tension control point.)
How To Calculate The Pure Compression Capacity Of A Concrete Column
The pure compression capacity or the squash load is the strength of the column under pure axial loading.
Using the ACI 318-19 section 22.4.2 we can calculate the pure compression load for a concrete column using the following formula:
P0 = 0.85 f'c * (Ag - Ast) + fy * Ast
where:
- f'c is the concrete compression strength
- fy is the rebar yield strength
- Ag is the gross area of the section
- Ast is the total area of the steel rebar
- (Ag - Ast) is the effective cross sectional area of concrete.
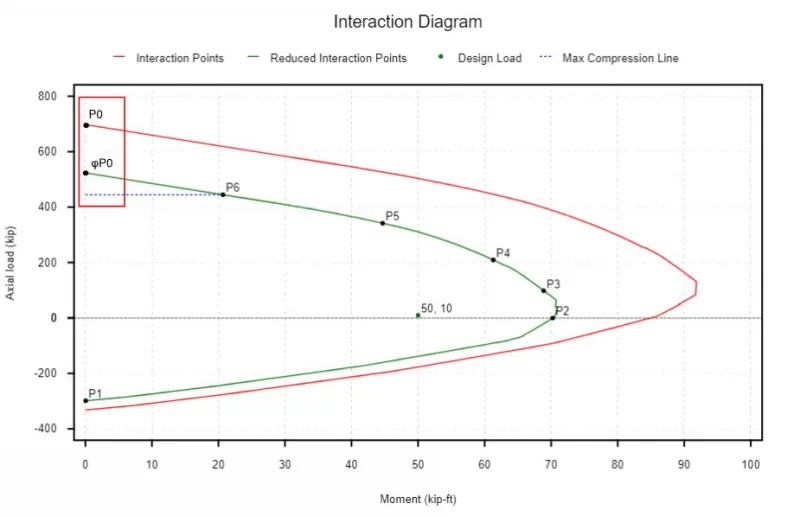
This point corresponds the the very top left of the interaction diagram without a strength reduction factor applied. We can reduce this value by our strength reduction factor for the compression controlled region (since we are in pure compression we are certainly in the compression controlled region). The ACI 318-19 however imposes a maximum limit beyond this which is given by the dashed-blue line and is covered in the next section.
How To Calculate The Maximum Allowable Compression Capacity Of A Concrete Column (ACI)
To account for accidental eccentricity the ACI 318-19 limits the maximum allowable compression compacity of a reinforced concrete column to 80 to 85 percent of the pure nominal compression capacity calculated in the previous section.
The reduction depends on the type of member and the transverse reinforcement used in the column (see table 22.4.2.1 of ACI 318-19).
Generally we have the following where the transverse reinforcement is ties:
Pn,max = 0.80 * P0
Or if the transverse reinforcement is spirals:
Pn,max = 0.85 * P0
How To Calculate The Pure Tension Capacity Of A Concrete Column (ACI)
The tension strength of the reinforced concrete column comes entirely from the strength of reinforcement and is proportional to the area of reinforcement that we have.
The formula to calculate the axial tension strength of a reinforced concrete column is simply:
Pnt,max = fy * Ast
&
P1 = φ * Pnt,max
Since the section is in pure tension and all our bars are considered to be yielding the section is tension controlled and the strength reduction factor φ is always 0.9.
How To Calculate The Balance Point Capacity Of A Concrete Column
The balance point is defined as the loading that causes the extreme tension member to first yield εt = εty at the same moment that the concrete yields. The method used to calculate the column strength (for flexure and axial compression or tension) at this point is the same as the method used for other points with a specific εt (i.e. εt = 0, εt = 0.5 εty).
We can first calculate the yield strain of the reinforcement using hookes law:
εty = fy / E
For a 60 ksi bar with a Young's Modulus of 29000 ksi we have a yield strain of
εty = 60/290000 = 0.00207
We also always take the yield strain for concrete to be 0.003 (defined in section 22.2.2.1 of ACI 318-19).
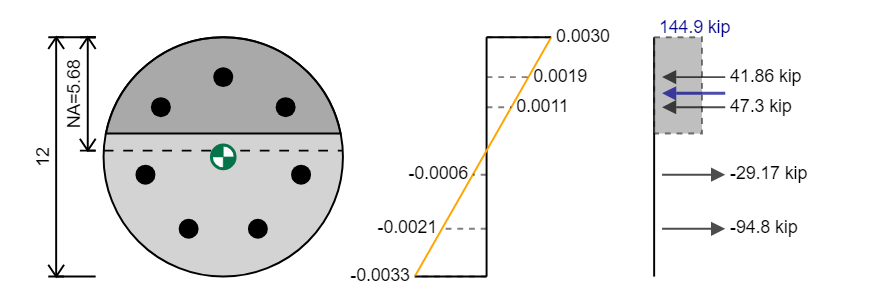
Using these two values we can plot our strain-diagram and based on the strain diagram we can determine the stresses on our section. The calculation of stresses is covered in the next two sections.
How To Calculate The Force On Reinforcement In The Concrete Column
Calculating the stress and force in the reinforcement is similar to how we calculated the pure tension strength. Our stress is equal to our strain times our Young's Modulus but is limited by our yield stress.
σ = min( εt * E , εty * E )
We can then determine the force on our bars by multiplying the stress by the area of the bars in this row. To simplify calculations where we have multiple bars with the same strain we can group these all together.
Ft = σ * A
We need a way to distinguish between our force being in compression or tension. We could use Ft and Fc to denote the different forces but for this example and in the SkyCiv Calculator we will use a sign notation of negative representing tension and positive representing compression.
How To Calculate The Force On A Concrete Stress Block
Calculating the stress on the concrete component of our reinforced concrete column is slightly more complicated because the stress distribution for a concrete section is not linear and instead is approximately parabolic. Fortunately, there exists an empirical simplification for the calculation of stresses on the concrete section known as the Whitney Stress Block method. In this method we approximate the parabolic stress distribution as a rectangular stress block.

The ACI describes this method in section 22.2.2.4.1. We calculate a as:
a = β1 * c
where β1 ranges from 0.65 to 0.85 depending on the compression strength (f'c) of concrete (see Table 22.2.2.4.3).
when we calculate the force on the stress block we always use an effective stress of 0.85 * f'c.
So we can calculate the compression force as:
Fc = 0.85 * f'c * β1 * c
and the force acts at a position a/2 from the extreme compression edge.
How To Calculate The Axial Capacity Of A Concrete Column From A Stress-Strain Diagram
We now have all the strains, stresses and forces on the reinforcement and concrete in our section but we still have not specified what the axial capacity or flexural capacity for this section is.
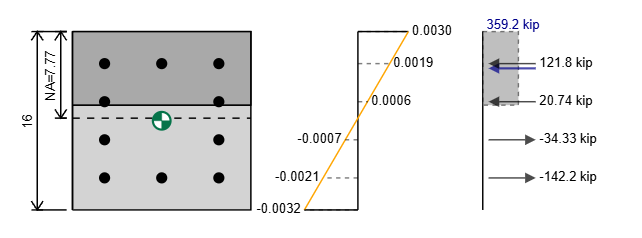
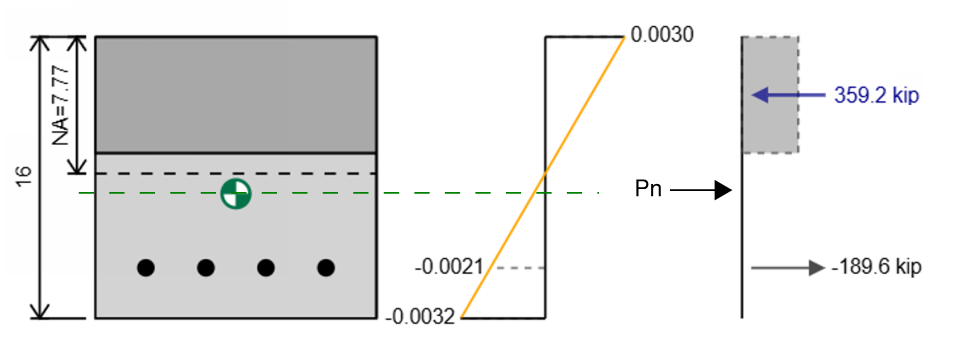
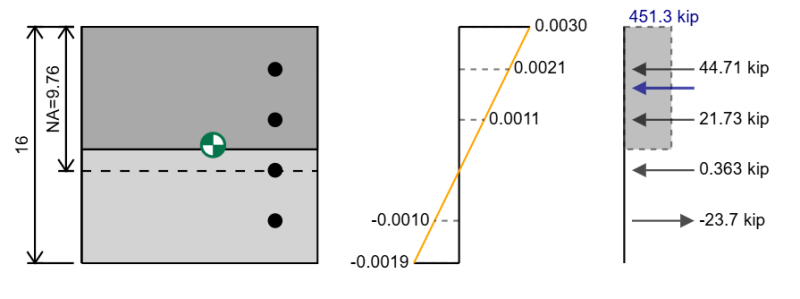
The axial capacity is the resultant force and the position that it acts at is the plastic centroid (green centroid marker in diagram). In the above example the axial capacity is
Using the principles of statics we can use our force diagram to determine the capacity of our section. First we can use the sum of forces to determine the axial capacity, knowing that our total compression forces must be equal to our total tension forces.
ΣFx = 0 → ΣC = ΣT
We can then sum the steel compressive forces and the concrete compressive force and the steel tension forces to find out the resultant force which is the axial capacity of our section.
Pn = ΣC - ΣT
For example if we have 359.2 kip of compression and 189.6 kip of tension for the section the resultant force is 359.2 - 189.6 = 169.6 kip. Note that the force drawn that would completely balance the section (ie a tension force of 169.6) is the opposite of the capacity which is 169.6 kip in compression since we can
How To Calculate The Flexural Capacity Of A Concrete Column From A Stress-Strain Diagram
We now know that we require a force acting on our section to balance it. This force acts at the plastic centroid of the section which is marked by the green centroid marker in the drawing above.
To find the plastic centroid the calculations are the same as for a normal centroid calculation except instead of multiplying A by a distance we multiple F by a distance.
To calculate the flexural capacity we can take moments about any position and we will get a net moment. We can take the moments about the position of the plastic centroid so then we dont need to worry about the force Pn in our calculations since its lever would be 0. A table can be helpful for these calculations particularly when we have many layers of reinforcement.
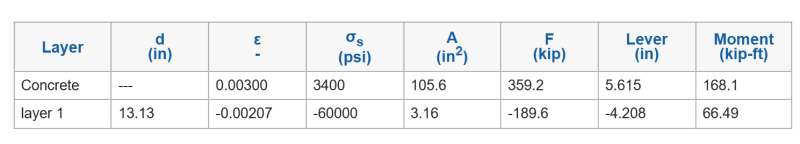
We can see the calculations for our moment capacity are
Mn = ΣF x lever = 359.2 x 5.615/12 + -189.6 x -4.206/12 = 168.1 + 66.5 = 234.6 kip-ft
A positive moment signifies that the top of the section is in compression and the bottom of the section is in tension.
How To Calculate The Reduced Flexural And Axial Capacity Of The Concrete Column
We have calculated a moment capacity of 234.6 kip-ft and a compression capacity of 169.6 kip however these are our ultimate capacities and need to be reduced by a strength reduction factor phi.
Since we are currently considering the balance point and we have εt = εty then we are in the compression controlled region and must use a factor of safety of 0.65 or 0.75 depending on the transverse reinforcement in the reinforced concrete column.
Plotting An Interaction Diagram
So far we have seen how to calculate
- (P1) Pure Tension Point
- (P6) Pure Compression Point
- (P3) Balanced Point
Using the same procedure as the calculation for the Balanced point we can also calculate the axial and flexural capacity for:
- (P4) Half-Yield Point
- (P5) Decompression Point
The difference between these three points (P3,P4,P5) is simply the initial assumption we make in generating the strain diagram with every step following being the same.
With these five points determined the only point we have not calculated for is the pure bending point. This point corresponds to the point at which we have Pn = 0 in our section. To determine this point we require an iterative solution where we guess a neutral axis position (value of c in ACI) and determine if Pn = 0. Once we have found this position of the neutral axis we can then continue with our steps like we did for the balance point.
With every value determined we can then generate an interaction diagram for our reinforced concrete column. We can simply draw our key points and plot a straight line between them to create a simple interaction diagram. With software like the SkyCiv Quick Design Concrete Column Calculator we can generate many more points in the interaction diagram rather than just the key points which can give as a smoother and more accurate plot.
Another point that may be useful to plot when designing to the ACI 318-19 is the tension control transition point since it is where the phi factor starts to change just like it does at position P3 which is the compression control transition point. Also note that because there is a reduction on the maximum allowed pure compression force (denoted by the blue line) the maximum compression force can also resist some moment capacity denoted by point P6 in the graph below.
How To Read An Interaction Diagram?
So far we have learnt a lot about how to create an interaction diagram but how can we use it in our design and why is it necessary.
Ultimately, the interaction diagram is useful because it always the same for our section (when bending in a certain direction) and is not dependent on the variations of our axial force and moment.
If we were to only calculate if our section had capacity for a single axial force and moment combination we might not need the diagram but it will make for very repetitive calculations if we have multiple different load combinations and forces that we want to consider.
The interaction diagram provides use with a visual tool that allows us to quickly determine if a certain load combination meets the requirements of the design standard we are using such as the ACI 318-19. All we need to do is plot our point and make sure that it is inside the area of our interaction diagram, and we could plot many different load combinations all at the same time.
Utilization ratios are slightly arbitrary since we are mainly concerned with if we are inside the area or not, however we can define utilization ratios by how far we are from a particular boundary. Our distance in the x axis is our moment utilization for the interaction diagram and our distance in the y axis is our axial utilization for the interaction diagram.
How To Create An Interaction Diagram for Biaxial Bending On A Concrete Column
The interaction diagram we have previously looked at was for uniaxial bending of a rectangular reinforced concrete section. We have only considered the bending to be happening about one axis but we could also have minor axis bending. For minor axis bending we would do everything the same except we would rotate the section 90 degrees so instead we would have something like this.
For biaxial bending we need to rotate our section so that is bending about the plane of its resultant moment. The interaction diagram we would get for this biaxial diagram is only relevant for this particular direction of resultant moment.
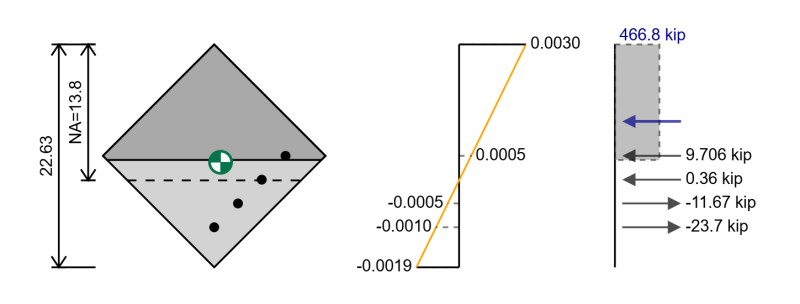
We can follow the same steps as we did for the interaction diagram previously except now we will have different positions for our reinforcement and in the case of a rectangular section in biaxial bending we have a triangular area that is in compression.
Instead of calculating the concrete compression force as:
Fc = 0.85 * f'c * β1 * c
We can instead calculate the concrete compression force as:
Fc = 0.85 * f'c * A
where A is the area in compression above the position a = β1 * c
What Is A 3D Interaction Diagram?
One of the limitations of creating a 2D interaction diagram for biaxial bending is that it is only relevant for one particular resultant moment direction. We now have three variables in considering our capacity why are Mz, My and N. Naturally instead of using a 2D chart which can only handle two axes and therefore two variables we can instead create a three dimensional interaction diagram which can handle three variables.
Like the 2D interaction diagram our objective is to have our load combinations inside the area of the chart the difference now being that we have three points to consider (Mz, My,N) and our point needs to be contained in our interaction diagram volume (rather than area). This is a useful visual tool for assessing multiple points at the same time but its limitation is that it is difficult to use in 2D mediums such as static graphs or images and an interactive software is required to fully utilize such a graph. SkyCiv Section Builder can help in generating 3D interaction diagrams which are easy to work with.
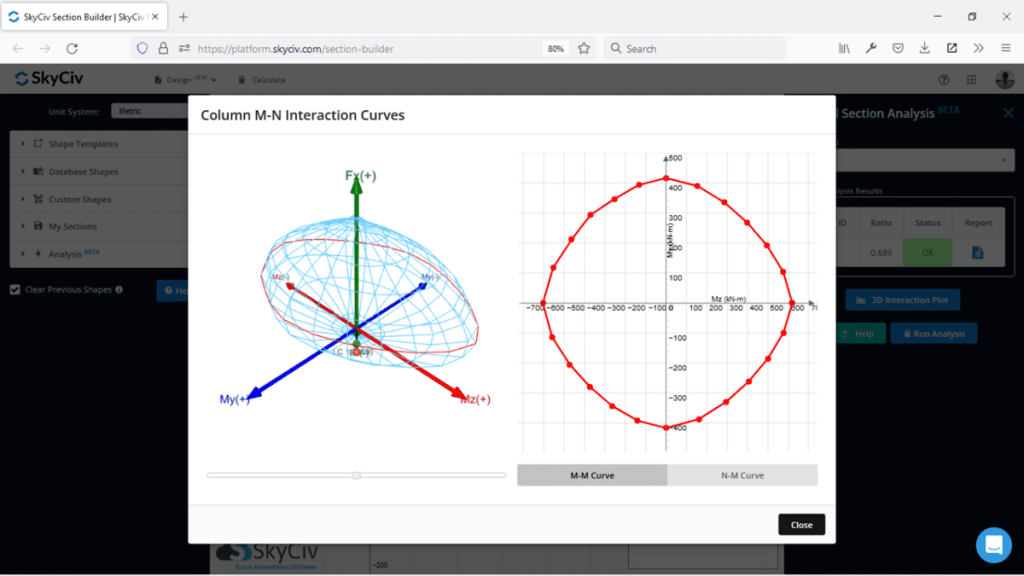
How to Create a 3D Interaction Diagram
To get all the data points we need to create a 3D interaction diagram we do the same 2D assessment that we did before except now we do it multiple times as we gradually rotate the section around. We can use what ever rotation we like, a reasonable angle could be 15 degrees which would give us 24 different angles.
Getting the data by hand is tedious but possible but using that data to create a 3D interactive interaction diagram is extremely difficult. 3D interaction diagrams are best used with software like SkyCiv Section Builder.
Related Tools
About SkyCiv
SkyCiv offers a wide range of Cloud Structural Analysis and Design Software for engineers. As a constantly evolving tech company, we're committed to innovating and challenging existing workflows to save engineers time in their work processes and designs.
