Calculate File
The calculate.js file is where all the action happens. The calculate file uses javascript. This is where you write the logic that performs the necessary transformations on your input to create your desired output. The calculate.js file must always return an output object based on the format specified below. The calculate.js file also handles all reporting functions, and returns the report that is generated by your calculator.
Layout#
ReportHelpers#
ReportHelpers is a library designed to help you format and write reports easily. Find the documentation for ReportHelpers here.
Output#
Output Variable Options#
Each output variable can have the following keys:
| Key | Description |
|---|---|
| label | The label for the result |
| results_label | Overrides the label for the result panel. |
| value | The value of the result |
| units | The units of the result |
| info | Tooltip added to the result |
| hidden | If true hide the result |
| paid_only | Make result only available to paid users |
| standout | Make the result standout in larger font! |
| note | Optional note about the result. |
| hide_in_s3d | Hide the result in the S3D output table. |
| round | Specify the rounding to appear in results. |
| integer | Output is an integer (no rounding). |
Output Settings#
The settings key is used to control certain elements of the output results.
| Key | Description |
|---|---|
| note_style | Either icon or below. |
| show_log | Show the log icon. |
| show_feedback | Show the feedback icon. |
Special Result Types#
By using the following strings as the units value, special results types can be created.
| Key | Description |
|---|---|
| utility | Display result as PASS/FAIL |
| utility_status | Display result with adjacent PASS/FAIL |
| utility_boolean | Display result box with PASS (value = 1) & FAIL (value = 0) |
| heading | Heading Object |
| error | Error Object |
| price | Price object with $ symbol |
| price_euro | Price object with € symbol |
Utility Box vs Utility Status Examples
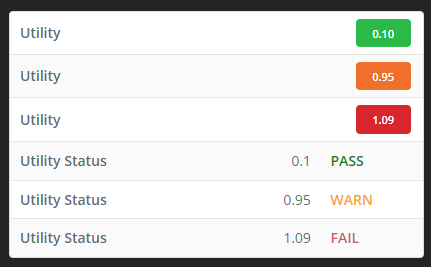
The below image highlights the difference between utility box (default option) and the utility_status result objects.

Utility Color Rules
All utility boxes work with the following rules:
< 0.95 = PASS (GREEN)>= 0.95 < 1 >= WARN (ORANGE)>= 1 = FAIL (Red)
Utility Booleans do not have a warn option.
Custom Boxes#
Custom boxes allow you to full customize a utility box with your own text/colors

QD Colors#
- RED: #DB2828
- GREEN: #21BA45
- ORANGE: #F2711C
Warning Boxes#
Similar to a custom box with the colors of a warning to ensure consistency.
Globals#
The following globals variables are available in the calculate.js:
| Global | Purpose | |
|---|---|---|
config_json | Access the config_json element to access values | let unit = config_json['variable_key']["units"] |
Other Packages#
SVG Section Dimensions#
See the SVG Section Dimensions Documentation.
SVGCreator Package#
Available Methods
For full documentation see the Quick Design UI Page.
Pretty Print Package#
Option for ability to print numbers nicely
PrettyPrint.pretty_print.print()#
Set Precision while Printing#
With Trailing Zeros#
Define digits after exponent#
Using engineering notation (only multiples of 3 are used in exponents)#
Using engineering notation (with significant digits instead of digits after decimal)#
PrettyPrint.pretty_print.numberWithCommas()#
SVG Section Dimensions#
See the SVG Section Dimensions Documentation.
Chart JS Integration#
See the ChartJS Integration Docs
Plotly JS Integration#
See the PlotlyJS Integration Docs
Opening S3D Models#
You can give users the option to open S3D models from the Quick Design by returning the s3d_model key in the results.
Warnings#
Quick Design has an inbuilt warn function to help you add warnings to the calculate.js and notify user of potential issues they should be aware of.
To call the warn function follow the example below:
Handling Errors#
Use the below code to handle errors:
caution
Do not use throw new Error
Debugging your Code#
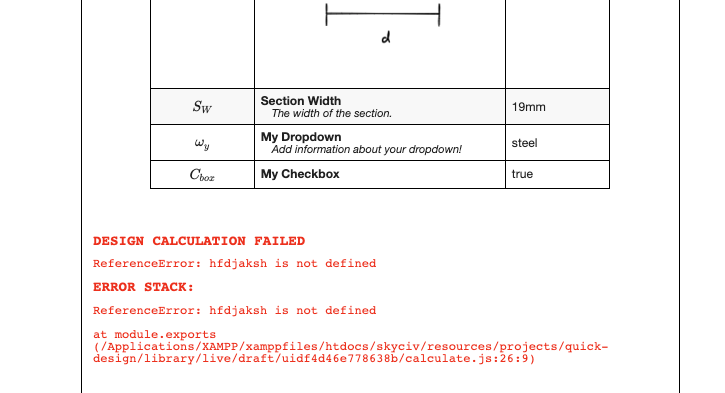
Since the code is running on our server (under a controlled environment) it may be difficult to debug. Errors are caught and returned to the user as a notification and in the actual report:

Logging:#
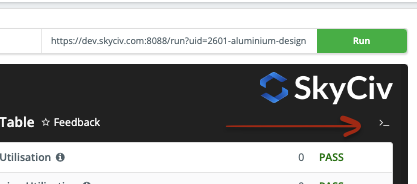
When you run your calculations, these will be available in the top corner of your code:

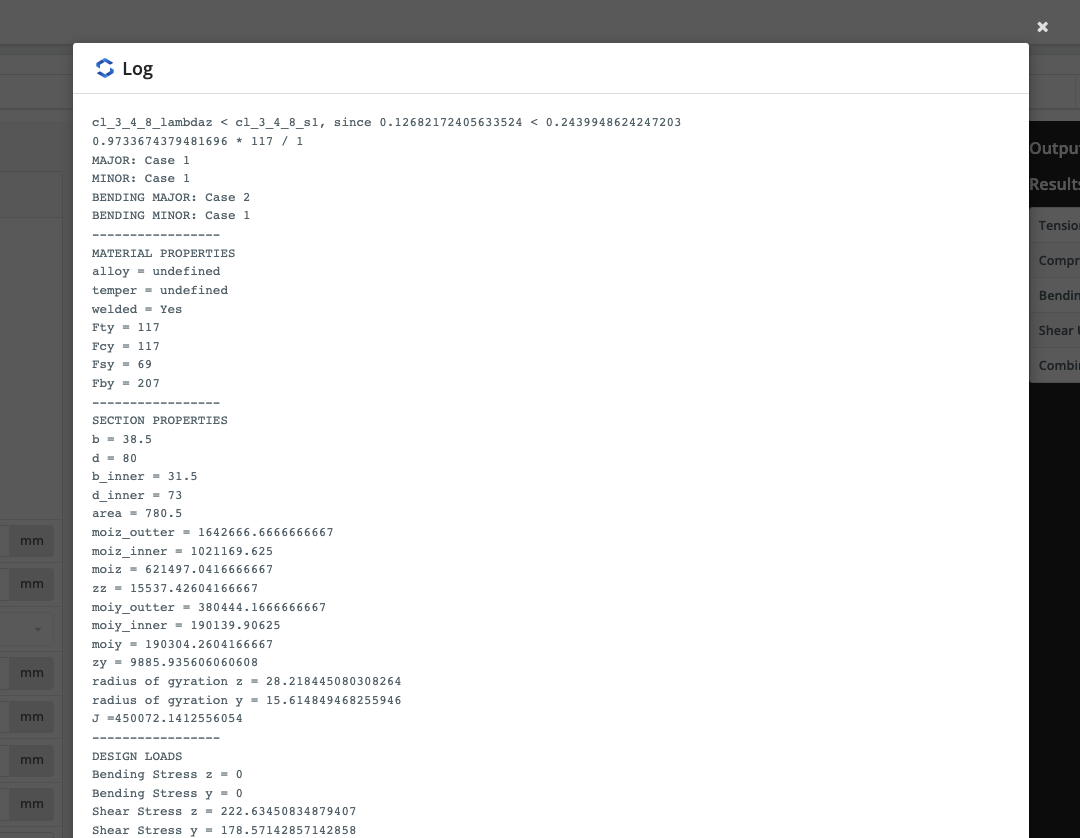
Having a detailed log will help both you and the user identify issues in the code:

State Management#
The state management helper allows you to access the state object from any context or util.