Reporting
SkyCiv Quick Design has an input library called ReportHelpers designed to help you format and write reports easily.
Basic Reporting#
Blocks#
Blocks are the lowest level of reporting and can be used to customize your reporting however you need it. We have a number of wrapper functions (shown in later functions) but this is the most direct way you can report. The variable REPORT is a global veriable that is accessible within your module.
Text and Formatting Functions#
ReportHelpers.getGlobalColors()#
Returns a list of global colors
Color Table#
| Name | Color Swatch | Hex Value |
|---|---|---|
| red | #DB2828 | |
| green | #21BA45 | |
| orange | #F2711C | |
| red_light | #B31E1E33 | |
| green_light | #16AB3933 | |
| orange_light | #F2620233 | |
| fluro_green | #5EFF33 | |
| fluro_red | #FF335E | |
| fluro_orange | #E67E22 | |
| hightlight_blue | #7FB8E6 | |
| hightlight_blue_light | #D6EDFF | |
| highlight_yellow | #F7DC6F | |
| highlight_yellow_light | #F7DC6F33 | |
| national_annex_color | #99C5C4 | |
| subheading_blue | #145DA0 | |
| table_header_grey | #F7F7F7 | |
| text_black | #000000DE |
ReportHelpers.getUtilityColor()#
Converts a number into a utility color
ReportHelpers.heading()#
This will print a heading at the top of a new block.
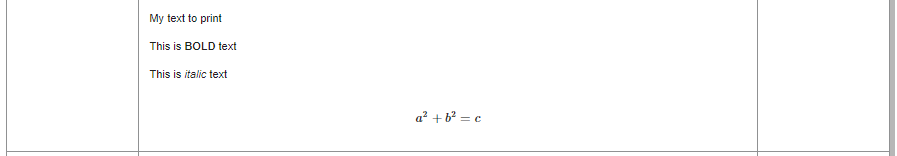
ReportHelpers.print()#
This will print a clean formatted text in the left column of the report. Bold and italic options are available like markdown.
::note If you add raw HTML to your print it will print that in the report. ::
ReportHelpers.pageBreak()#
Add a page break in the report. All content below will start on a new page.
ReportHelpers.subBreak()#
Add a sub break between sections. This is just to provide separation between different sections in the same block.
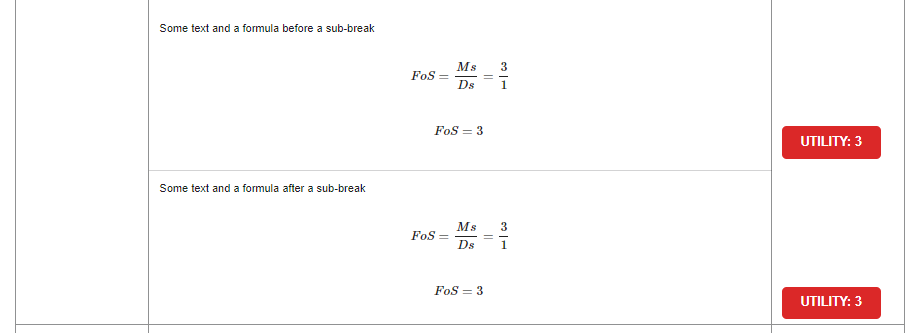
ReportHelpers.lineResult()#
This will create a nice easy and lightweight reporting option. Rather than showing full equations, you might just want to print intermediate results:
Note: You will need to open a REPORT block for this to be visible:
ReportHelpers.messageBox()#
Creates a nice looking message box for displaying error messages or warnings to the user.

Options#
| Parameter | Description |
|---|---|
| Message Body | The main content or message to display in the message box. |
| Message Title | The title of the message box. |
| Style (optional) | The style of the message box, such as "warning" for a warning message. |
| Reference (optional) | Additional information or reference related to the message, displayed in the message box. |
| Result (optional) | Information or result related to the message, also displayed in the message box along with the reference, if provided. |
ReportHelpers.customFormat()#
Shortcut to format output in certain ways
ReportHelpers.list()#
Puts a list into the report. The options parameter and all its supported options are optional.
Options#
| Option | Description | Type |
|---|---|---|
| heading | Specifies the heading for the shopping list | String |
| heading_size | Sets the size of the heading (1-5) | Number (1-5) |
| reference | Provides a reference or additional information | String |
| list_type | Specifies the type of list (ordered/unordered) | "ordered" or "unordered" |
ReportHelpers.padding()#
Adds 2px of padding to the report.
Tables, Graphs and Images#
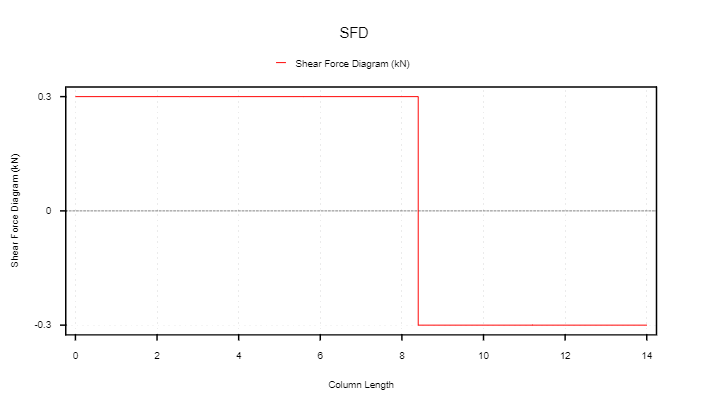
ReportHelpers.drawGraph()#
Will draw a nice BMD/SFD diagram with a simple array:
ReportHelpers.image()#
Will print an image in the report
tip
Images can be hosted/served directly from the calc pack by including an images folder. Reference all images included in the image directory as /image_name.png.
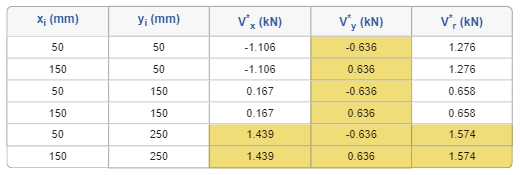
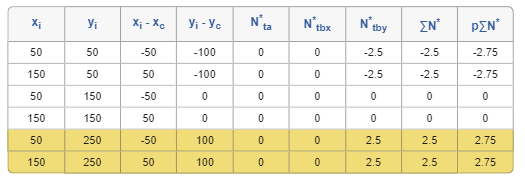
ReportHelpers.quickTable()#
Create and display data in a table format.
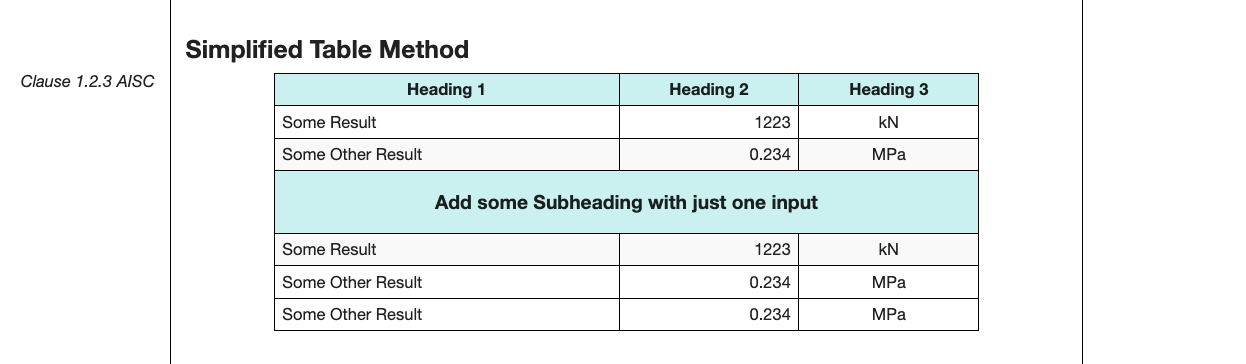
Advanced Table Options#
Merging Cells Example
- Use the
merge_lefttext to merge cells to the left. - Use the
merge_uptext to merge cells upwards.
- Cell Coloring
options.cell_backgrounds- Takes an array of arrays in the format [row_idx, column_idx, hex_code].
- With
ReportHelpers.tableColorCritical- Easily color the max values in a table based on columns/rows.
- With
ReportHelpers.tableColorUtility- Easily color a column based on utility values rules. Automatically includes columns that contain the words
utilityor if specified.
- Easily color a column based on utility values rules. Automatically includes columns that contain the words
Example ReportHelpers.tableColorCritical
Rows Example ReportHelpers.tableColorCritical
Example ReportHelpers.tableColorUtility
Maths, Formulas and Status#
ReportHelpers.round()#
Will round any number to 2 decimal places, or if you provide a second argument it will round to that figure. It will work with strings and handle NaNs without crashing.
This will return a number back, that way you can continue to use this as a number (not a string)
ReportHelpers.formula()#
Will automatically evaluate and print an equation to represent the result. Note: .formula() does not support {} characters. For this you will need to use lower level REPORT functions. Please do not include mathjax [math][math] tags as this will stop the formula from evaluating correctly.
Max and Min Functions#
You can use 'Math.min' and 'Math.max' functions with ReportHelpers.formula(). Normal MathJax formatting is not available with this option. An example is below:
Parameters#
| Field | Description |
|---|---|
formula | The formula to use for the equation in MathJax. |
variables | The set of variables with their values to sub into the equation. Values can be a number or can also be a object with keys { value: value, unit: unit }. |
units | Unit for final results. |
dec_places | Number of decimal places to round final results too. |
compact | OPTIONAL: Force all of the equation and result onto one line. |
intermediate_result | Include a intermediate step where values are subbed into the original equation. |
new_line_intermediate | OPTIONAL: Put intermediate step on a new line. |
reference | Prints the reference of the equation in the left column. |
print_result_as_utility | OPTIONAL: Prints the result as a utility ratio on the right column of report. |
exclude_result | OPTIONAL: Don't print the result line. |
expected_result | OPTIONAL: Check that the formula evaluates to an expected result, throws an error if the results don't match. |
convert | EXPERIMENTAL: Convert the result to a new units system (i.e. m -> mm). Unit for final results must be deinfed to work. Refer to notes below. |
Parameter - convert
Experimental module to allow use to conver tin the formula (i.e. turn meters into millimeters). Please confirm this is working correctly for your units before using. Currently this does not work with min and max formulas.
Output#
tip
You can include Greek Alphabet Characters in the formula by copying the character from this link.. This will work better thing including them with MathJax.
danger
The ^ symbol in Javascript works as a XOR operator and will break your equations. Please insure you use Math.pow() instead.
ReportHelpers.printMathjax()#
A helper to let you easily print MathJax in cases where ReportHelpers.formula() falls short.
tip
Checkout the sample repo here to see it in action.
ReportHelpers.printStatus()#
This will automatically format a clean color-based result on the right side of the table. It will automatically read a value, and if it is > 1 it will show a red FAIL. If it is < 1, it will show a green PASS:
ReportHelpers.getStatusBlock()#
This will automatically return the html of the clean color-based result from ReportHelpers.printStatus()
ReportHelpers.printCustomStatus()#
This will automatically format a clean color-based result on the right side of the table. If you pass in pass, fail or warn then colors will be automatically assigned otherwise you can specify custom colors with the last parameter
ReportHelpers.getStatusBlock()#
This will automatically return the html of the clean color-based result from ReportHelpers.getCustomStatusBlock()
Conversion#
ReportHelpers.convert()#
Converts units
tip
For a list of supported units see Quick Design Units
Tips#
tip
MathJax in the QD Framework replaces / with //. This will differ from equations you might find in the MathJax Documentation
tip
To add a space in pure MathJax, such as a space in the symbol key used in config.js you can use \\ ;
Full Width Blocks#
To include a full width block without a REFERENCES or RESULTS column you can use the ReportHelpers.customFullBlock(obj); function. This function
takes the following options:
| Parameter | Description |
|---|---|
title | Title that is automatically added to the full width block. |
content | The HTML content to add to the full width block. This must be all the content to be included you cannot add more content later. |
font_size | Font size of the heading in the block (default 3 i.e <h3> tags). |
margin_left | Margin left of the title in pixels or %. Default 10%. |
As this block takes html you can use some lower level functions to return the HTML of some of the above functions. These include:
| High Level Function | Low Level Function |
|---|---|
ReportHelpers.quickTable() | ReportHelpers.quickTableHTML() |
ReportHelpers.image() | ReportHelpers.imageHTML() |
ReportHelpers.lineResult() | ReportHelpers.lineResultHTML() |
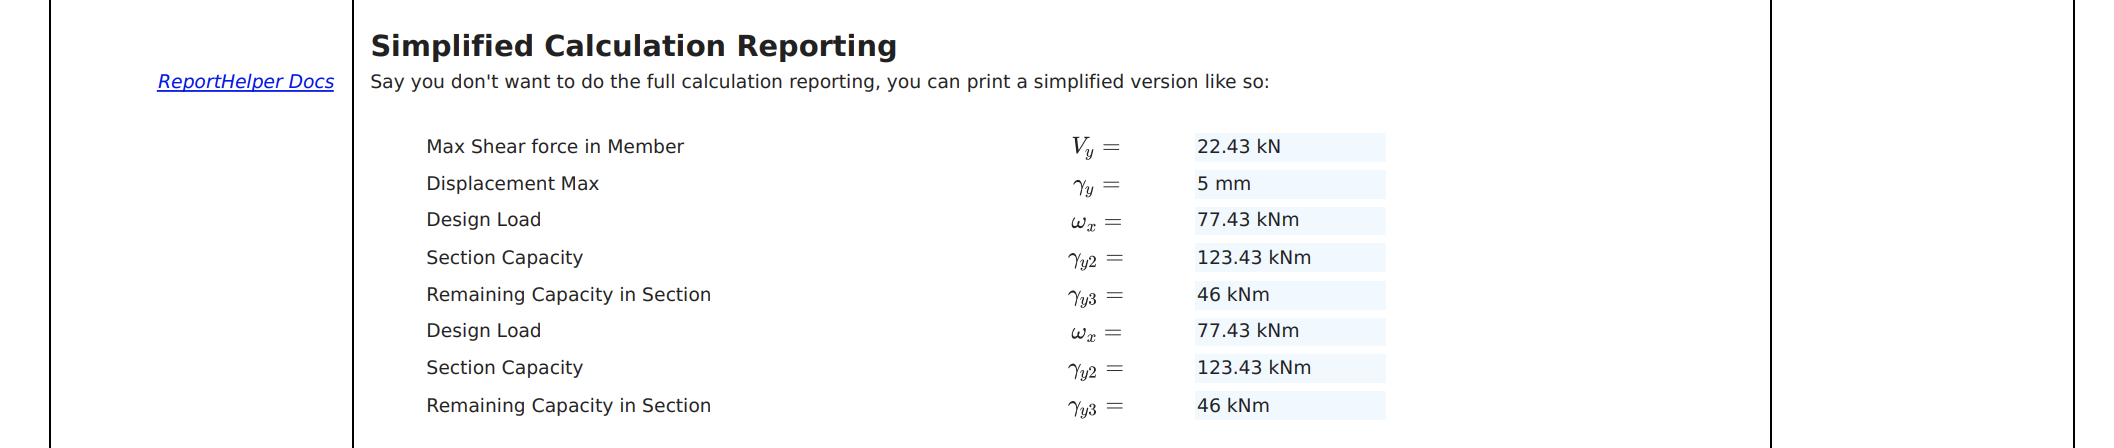
Summary Reporting#
The summary report is a simple one page report that list the key input, outputs, intermediate results and relevant graphics.
Summary Report Methods#
ReportHelpers.addKeyImage(key_image);#
This method takes either a image url, base64 string or pure svg html. In the case of svg html it converts the image to base64 for the report. By default this is done on a 400 wide by 380 tall canvas, however for better scaling you can specify the rendering width in the summary report settings.
ReportHelpers.addSecondaryKeyImage(key_image);#
Adds a secondary image, so long as "key_image_own_line" is set to true;
ReportHelpers.addIntermediateResults(name, value);#
Adds an intermediate result to the report.
Summary Report Settings#
You can specify summary report settings by including the summary_report_settings object in the calculate.js output.
Example
Supported Settings
| Setting | Default | Description |
|---|---|---|
key_image_own_line | false | Add the key image on its own line. |
key_image_width | 400 | The canvas width (px) to render svg key images on. |
key_image_height | 380 | The canvas height (px) to render svg key images on. |
secondary_key_image_width | 400 | The canvas width (px) to render svg key images on. |
secondary_key_image_height | 380 | The canvas height (px) to render svg key images on. |
intermediate_results_columns | 2 | The number of columns to show in intermediate results. |